HOT TOPICS LIST
- MACD
- Fibonacci
- RSI
- Gann
- ADXR
- Stochastics
- Volume
- Triangles
- Futures
- Cycles
- Volatility
- ZIGZAG
- MESA
- Retracement
- Aroon
INDICATORS LIST
LIST OF TOPICS
PRINT THIS ARTICLE
by Mike Carr, CMT
After a gain of almost 30% in three months, gas futures finally look like they are a short.
Position: Sell
Mike Carr, CMT
Mike Carr, CMT, is a member of the Market Technicians Association, and editor of the MTA's newsletter, Technically Speaking. He is also the author of "Smarter Investing in Any Economy: The Definitive Guide to Relative Strength Investing," and "Conquering the Divide: How to Use Economic Indicators to Catch Stock Market Trends."
PRINT THIS ARTICLE
STOCHASTICS
Gas Prices Finally Set Up For A Fall
04/11/12 08:51:10 AMby Mike Carr, CMT
After a gain of almost 30% in three months, gas futures finally look like they are a short.
Position: Sell
| Gasoline prices have run up at the pump and in the futures market in recent months. The chart of gasoline now looks almost exactly like it did in 2008 (Figure 1). After peaking in the summer of 2008, the gasoline market crashed and retail prices fell below $2 a gallon for a very brief time in late 2008 and early 2009. With the daily chart of gas futures looking very much like it did at the 2008 market peak, that could mean now is a good time to short gasoline. This trading idea is easiest to implement in the futures market. Open interest in the RBOB gasoline market is more than 340,000 contracts and individuals can usually trade in that market with sufficient liquidity. RBOB stands for "reformulated blendstock for oxygenate blending" and is the formal name for the gasoline futures contract. Symbols vary by quote vendor, but gasoline contracts usually include RB in the trading symbol. As always in futures markets, nearby markets have the greatest liquidity and are usually the best trading option. |
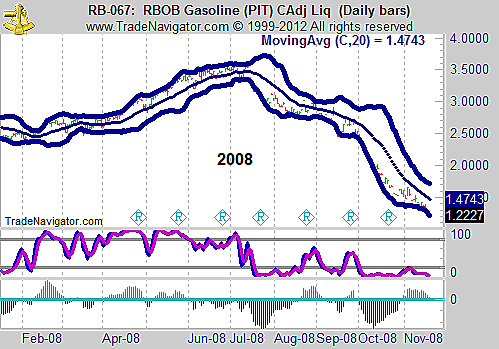
| Before considering the current state of the market, we'll look at the top in 2008 (Figure 1). Gas prices had run up sharply over several months and consumer frustration was growing with each new high. Prices reversed suddenly before falling as sharply as they had risen. The lows coincided with the worst of the financial crisis that gripped the global economy at that time. The market once again showed how difficult it is to project macroeconomic trends as commentators were bullish at the top and bearish at the bottom, completely missing the economic forces that were determining the trends. From a technical perspective, the summer top was accompanied by a negative moving average convergence/divergence (MACD) and a bearish divergence in the stochastic. These simple tools could have helped traders at least close long positions, if not enter shorts. |

|
| FIGURE 1: RBOB, DAILY. The bearish divergences in 2008 are obvious in hindsight in this chart of gasoline futures. |
| Graphic provided by: Trade Navigator. |
| |
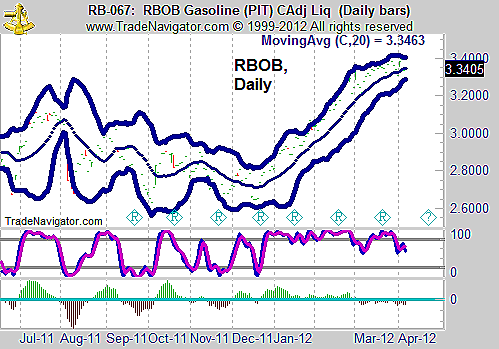
| A similar setup is present in the chart now (Figure 2). Gas prices have moved up along the upper Bollinger Band, and the MACD has turned negative, even as the price is reaching new highs. A bearish divergence in the stochastic has formed. Recent price action has broken below the 20-day moving average. Aggressive traders could short gas now; more conservative traders could wait for another signal like a close below the 50-day moving average to signal a trade. |

|
| FIGURE 2: RBOB, DAILY. The current market bears a strong resemblance to the topping pattern shown in Figure 1. |
| Graphic provided by: Trade Navigator. |
| |
| This chart looks like a very strong bearish setup, but many traders will not take the trade because it is in the futures market. That should not be a deterrent to traders since the risk in futures trading can be easily handled with good risk management strategies. However, many individual traders will always prefer to avoid this market. There is no directly comparable exchange traded fund (ETF). There is an ETF that allows traders to go long gasoline, the US Gasoline Fund (UGA). This ETF seems to have a low tracking error with gas futures and could be a good substitute for futures on the long side. It could be shorted, but traders unwilling to trade futures should be reluctant to trade on the short side in an equity account. Costs for short positions can be high and risk could be unlimited. Inverse oil ETFs could be a substitute to shorting gasoline, but that requires a different analysis, and for traders to be sure the specific ETF is on a buy signal. |
Mike Carr, CMT, is a member of the Market Technicians Association, and editor of the MTA's newsletter, Technically Speaking. He is also the author of "Smarter Investing in Any Economy: The Definitive Guide to Relative Strength Investing," and "Conquering the Divide: How to Use Economic Indicators to Catch Stock Market Trends."
| Website: | www.moneynews.com/blogs/MichaelCarr/id-73 |
| E-mail address: | marketstrategist@gmail.com |
Click here for more information about our publications!
Comments

Request Information From Our Sponsors
- StockCharts.com, Inc.
- Candle Patterns
- Candlestick Charting Explained
- Intermarket Technical Analysis
- John Murphy on Chart Analysis
- John Murphy's Chart Pattern Recognition
- John Murphy's Market Message
- MurphyExplainsMarketAnalysis-Intermarket Analysis
- MurphyExplainsMarketAnalysis-Visual Analysis
- StockCharts.com
- Technical Analysis of the Financial Markets
- The Visual Investor
- VectorVest, Inc.
- Executive Premier Workshop
- One-Day Options Course
- OptionsPro
- Retirement Income Workshop
- Sure-Fire Trading Systems (VectorVest, Inc.)
- Trading as a Business Workshop
- VectorVest 7 EOD
- VectorVest 7 RealTime/IntraDay
- VectorVest AutoTester
- VectorVest Educational Services
- VectorVest OnLine
- VectorVest Options Analyzer
- VectorVest ProGraphics v6.0
- VectorVest ProTrader 7
- VectorVest RealTime Derby Tool
- VectorVest Simulator
- VectorVest Variator
- VectorVest Watchdog
