HOT TOPICS LIST
- MACD
- Fibonacci
- RSI
- Gann
- ADXR
- Stochastics
- Volume
- Triangles
- Futures
- Cycles
- Volatility
- ZIGZAG
- MESA
- Retracement
- Aroon
INDICATORS LIST
LIST OF TOPICS
PRINT THIS ARTICLE
by Donald W. Pendergast, Jr.
After a momentous six-month rally, the S&P 500 appears to have begun a correction that may take prices down toward support near 1340 -- or even lower.
Position: N/A
Donald W. Pendergast, Jr.
Donald W. Pendergast is a financial markets consultant who offers specialized services to stock brokers and high net worth individuals who seek a better bottom line for their portfolios.
PRINT THIS ARTICLE
CHART ANALYSIS
.SPX Confirms Mid-Term Top
04/11/12 08:40:43 AMby Donald W. Pendergast, Jr.
After a momentous six-month rally, the S&P 500 appears to have begun a correction that may take prices down toward support near 1340 -- or even lower.
Position: N/A
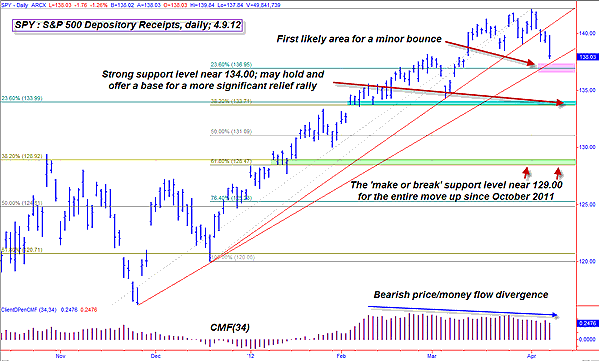
| The past five weeks have not been all fun and games for bears looking to short the mighty Standard & Poor's 500 (.SPX). The key large-cap index staged a superb fakeout move (known as a bear trap) to the downside between March 2 and March 6, 2012, luring many greedy bears into going short before quickly reversing and rocketing higher again in the following three to four weeks. Price action got a bit choppy and rangebound over the past couple of weeks, but now, with the large opening gap lower on April 9, 2012, the .SPX's reversal of trend is clear for all to see. Here's a closer look now (Figure 1). |

|
| FIGURE 1: SPY, DAILY. If SPY can't make a daily close above 140.00 soon, the odds favor a drop through the pink-shaded support area near 137.00. SPY's 40-day nominal price cycle is falling, which may be a boon to short-sellers jumping in on such a breakdown. |
| Graphic provided by: TradeStation. |
| |
| After analyzing thousands and thousands of charts since the late 1970s, I see a recurring chart dynamic that may be at work once again in this daily chart of SPY, the S&P 500 exchange traded fund (ETF). That dynamic is simple, but it repeats with enough reliability that it may be also about to happen in this particular index. The pattern is simple: 1. After an extended, multimonth rally where a major cycle high has been confirmed, expect prices to fall to the Fibonacci 23.6% retracement of the most recent major swing move within the larger uptrend. 2. Once that Fibonacci retracement eventually gives way (possibly after a feeble rally), expect prices to continue to fall to the next larger swing's Fibonacci 23.6% retracement. In this case, the swing that launched on December 19, 2011, is the smaller component of the huge general upswing that was birthed on October 4, 2011. The Fib 23.6% support for the December-April swing is at 136.95 and also happens to coincide with the powerful uptrend line that connects the October, November, and December 2011 lows. This confluence are is highlighted in pink and is the first likely area in which to expect price to find temporary support -- and maybe a feeble bounce higher before heading back down again. Should that first support (near 1370.00 on the .SPX and 137.00 in SPY) zone be broken soon, then expect a fairly swift thrust lower to the next Fibonacci support level near 1340.00 (.SPX) and 134.00 (SPY), respectively. This area of support, highlighted in blue, merges two separate Fibonacci grids from the two major swings previously mentioned and suggests that this will be a much more meaningful area of price support for .SPX/SPY. Barring any more flash crashes or news of another eurozone meltdown, this could be a prime area to expect a tradable bounce to appear, probably around late May or early June of this year. The 40-day price cycle is falling in this market, and that is one possible time window for this fresh decline to finally bottom out. Finally, there is the critical make-or-break support in green near 129.00. Any sharp, continuation of price below this will likely mean a major trend reversal, one that could target even lower price supports in this widely watched large-cap index. See Figure 2. |

|
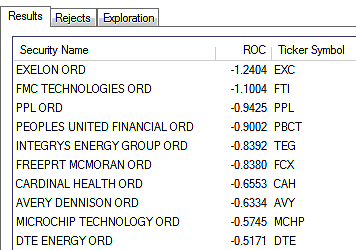
| FIGURE 2: LARGE-CAP STOCKS. Here are the large-cap stocks firing RMO swing sell signals that are also underperforming the .SPX over the past 13 weeks. |
| Graphic provided by: MetaStock. |
| Graphic provided by: MetaStock Explorer. |
| |
| One simple way to play .SPY/SPX here might to be this: wait for the pink support zone to be tested, and if you see a break below it, buy slightly in-the-money put options with at least two or maybe even three months of time value, attempting to ride them down toward the strong support level near 1340.00/134.00. If price gets close to the blue support zone, consider booking a nice profit and running for the hills, just in case a short-covering rally might be lurking in the wings as several price cycles attempt to bottom and turn higher simultaneously. As always, limit your risk to no more than 2% of your account value, just in case things don't go exactly as anticipated. |
Donald W. Pendergast is a financial markets consultant who offers specialized services to stock brokers and high net worth individuals who seek a better bottom line for their portfolios.
| Title: | Writer, market consultant |
| Company: | Linear Trading Systems LLC |
| Jacksonville, FL 32217 | |
| Phone # for sales: | 904-239-9564 |
| E-mail address: | lineartradingsys@gmail.com |
Traders' Resource Links | |
| Linear Trading Systems LLC has not added any product or service information to TRADERS' RESOURCE. | |
Click here for more information about our publications!
Comments
Date: 04/14/12Rank: 4Comment:

Request Information From Our Sponsors
- VectorVest, Inc.
- Executive Premier Workshop
- One-Day Options Course
- OptionsPro
- Retirement Income Workshop
- Sure-Fire Trading Systems (VectorVest, Inc.)
- Trading as a Business Workshop
- VectorVest 7 EOD
- VectorVest 7 RealTime/IntraDay
- VectorVest AutoTester
- VectorVest Educational Services
- VectorVest OnLine
- VectorVest Options Analyzer
- VectorVest ProGraphics v6.0
- VectorVest ProTrader 7
- VectorVest RealTime Derby Tool
- VectorVest Simulator
- VectorVest Variator
- VectorVest Watchdog
- StockCharts.com, Inc.
- Candle Patterns
- Candlestick Charting Explained
- Intermarket Technical Analysis
- John Murphy on Chart Analysis
- John Murphy's Chart Pattern Recognition
- John Murphy's Market Message
- MurphyExplainsMarketAnalysis-Intermarket Analysis
- MurphyExplainsMarketAnalysis-Visual Analysis
- StockCharts.com
- Technical Analysis of the Financial Markets
- The Visual Investor
