HOT TOPICS LIST
- MACD
- Fibonacci
- RSI
- Gann
- ADXR
- Stochastics
- Volume
- Triangles
- Futures
- Cycles
- Volatility
- ZIGZAG
- MESA
- Retracement
- Aroon
INDICATORS LIST
LIST OF TOPICS
PRINT THIS ARTICLE
by Koos van der Merwe
In today's market, we are always looking for a stock to buy. Yes, the indexes are correcting, but isn't that the time to buy?
Position: Accumulate
Koos van der Merwe
Has been a technical analyst since 1969, and has worked as a futures and options trader with First Financial Futures in Johannesburg, South Africa.
PRINT THIS ARTICLE
RSI
CNH Global Investments
04/10/12 08:31:56 AMby Koos van der Merwe
In today's market, we are always looking for a stock to buy. Yes, the indexes are correcting, but isn't that the time to buy?
Position: Accumulate
| CNH Global Investments is a stock to look at. CNH Global NV manufactures agricultural and construction equipment internationally. Its agricultural equipment segment manufactures tractors, combine harvesters, and other farming equipment. The construction equipment segment manufactures crawler excavators, graders, haul trucks, backhoe loaders, and more. The financial services segment offers financing for the purchase or lease of company products. |

|
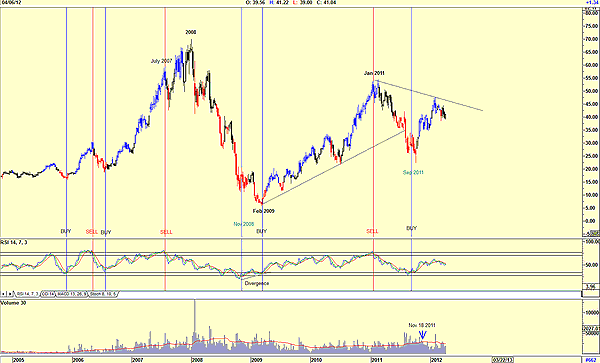
| FIGURE 1: CNH, WEEKLY |
| Graphic provided by: AdvancedGET. |
| |
| The weekly chart in Figure 1 shows how the share price fell and recovered along with the market. At the moment, it looks as though it could be in a period of indecision. A break above the downtrend line drawn from 2011 would be a major positive. Looking back over the history of the chart, you can see how the price followed the buy/sell signals of the relative strength index (RSI) 14-period indicator very closely, with the exception of the sell signal given in July 2007, which was a bit too early. But we should always leave the last 10% to the trader, so selling the stock early was foresight. The buy signal in November 2008 was also too early, but the divergence buy in February 2009 was a very good signal. Do note that since November 18, 2011, the volume was below average, a sign of weakness ahead. Knowing that the trend on a weekly chart is positive, we now look at the daily chart for further guidance (Figure 2). |

|
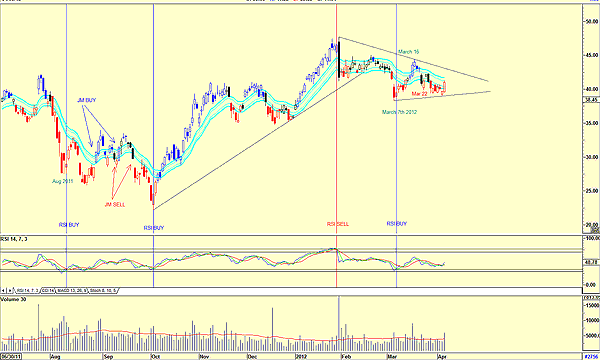
| FIGURE 2: CNH, DAILY |
| Graphic provided by: AdvancedGET. |
| |
| In the daily chart, you can see how the RSI gave a buy signal in August 2011, much too early. However, all the RSI buy and sell signals were very accurate. The chart also shows the JM internal band buy and sell signals. The JM internal band indicator is a 15-period moving average offset by 2% positive and 2% negative. A buy signal is given when the price breaks above the upper band. A sell signal is given when it breaks below the lower band. At the moment it is still negative, although it does appear to be testing the upper band. Finally, the XTL indicator is still showing a red bar, which is negative. The XTL indicator uses a statistical evaluation of the market. When the bars are blue, then the trend is up. When the bars are red, the trend is down. A black bar is a neutral bar. When a bar turns to blue or black, the first signal is called the breakout bar. An entry is taken when the bar following the breakout bar is the same color as the breakout bar. A stop would be placed below the breakout bar. The XTL indicator should only be used to confirm a trend. As at the last trade, the XTL bar is red, still suggesting weakness. CNH Global Investments appears to be consolidating. Although the RSI called a buy on March 7, 2012, and the JM gave a buy signal on March 16 with a sell signal on March 22, the XTL indicator is still red. I would wait for a change to black, or for a move above the JM upper internal band before buying. |
Has been a technical analyst since 1969, and has worked as a futures and options trader with First Financial Futures in Johannesburg, South Africa.
| Address: | 3256 West 24th Ave |
| Vancouver, BC | |
| Phone # for sales: | 6042634214 |
| E-mail address: | petroosp@gmail.com |
Click here for more information about our publications!
Comments

Request Information From Our Sponsors
- StockCharts.com, Inc.
- Candle Patterns
- Candlestick Charting Explained
- Intermarket Technical Analysis
- John Murphy on Chart Analysis
- John Murphy's Chart Pattern Recognition
- John Murphy's Market Message
- MurphyExplainsMarketAnalysis-Intermarket Analysis
- MurphyExplainsMarketAnalysis-Visual Analysis
- StockCharts.com
- Technical Analysis of the Financial Markets
- The Visual Investor
- VectorVest, Inc.
- Executive Premier Workshop
- One-Day Options Course
- OptionsPro
- Retirement Income Workshop
- Sure-Fire Trading Systems (VectorVest, Inc.)
- Trading as a Business Workshop
- VectorVest 7 EOD
- VectorVest 7 RealTime/IntraDay
- VectorVest AutoTester
- VectorVest Educational Services
- VectorVest OnLine
- VectorVest Options Analyzer
- VectorVest ProGraphics v6.0
- VectorVest ProTrader 7
- VectorVest RealTime Derby Tool
- VectorVest Simulator
- VectorVest Variator
- VectorVest Watchdog
