HOT TOPICS LIST
- MACD
- Fibonacci
- RSI
- Gann
- ADXR
- Stochastics
- Volume
- Triangles
- Futures
- Cycles
- Volatility
- ZIGZAG
- MESA
- Retracement
- Aroon
INDICATORS LIST
LIST OF TOPICS
PRINT THIS ARTICLE
by Chaitali Mohile
The Energy Select Sector SPDR has formed a symmetrical triangle on the monthly time frame chart.
Position: N/A
Chaitali Mohile
Active trader in the Indian stock markets since 2003 and a full-time writer. Trading is largely based upon technical analysis.
PRINT THIS ARTICLE
TRIANGLES
A Long-Term Symmetrical Triangle
04/09/12 12:38:00 PMby Chaitali Mohile
The Energy Select Sector SPDR has formed a symmetrical triangle on the monthly time frame chart.
Position: N/A
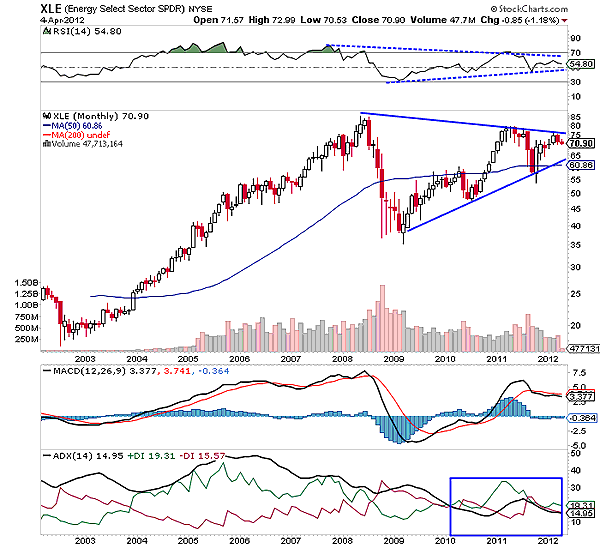
| A symmetrical triangle can appear in any trend. A breakout direction of this triangle is also uncertain. These are the two major features of the symmetrical triangle that differentiate it from the peer group; this triangle is formed by the two converging trendlines. In Figure 1, the Energy Select Sector SPDR (XLE) has been forming the symmetrical triangle for the past four years. The converging trendlines has narrowed the trading range of XLE, trapping many short-term as well as long-term traders. According to Figure 1, XLE has formed the triangle after a long bullish rally. Therefore, the pattern looks like a long-term bullish flag & pennant -- a bullish continuous formation. |
| If we considered the pattern as a flag formation, XLE is likely to break upward. However, the average directional index (ADX) (14) in Figure 1 is very weak and does not indicate any buying pressure. Therefore, we cannot assume the pattern as bullish. In addition, the older pattern loses its strength gradually. Hence, we will consider the pattern as a symmetrical triangle. |

|
| FIGURE 1: XLE, MONTHLY |
| Graphic provided by: StockCharts.com. |
| |
| The narrowing range is likely to induce high volatility, resulting in high trading risk for traders. We can see that the volume has lowered significantly. The moving average convergence/divergence (MACD) (12,26,9) is negative as the trigger line and the MACD line have tangled, indicating huge volatility. The relative strength index (RSI) (14) is also constructing the symmetrical triangle, and thus, the strength in the rally would remain unstable. Currently, XLE is plunging towards the lower trendline support, so a good short-selling opportunity is opened for short-term traders. But for the trading strategy we will follow an intraday chart. |

|
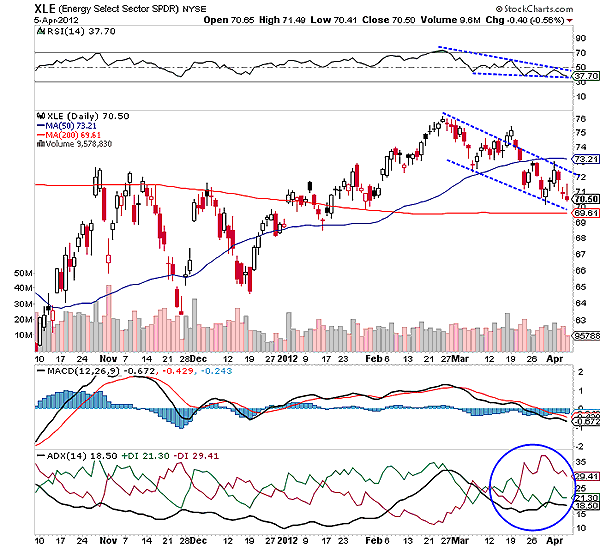
| FIGURE 2: XLE, DAILY |
| Graphic provided by: StockCharts.com. |
| |
| In Figure 2, XLE is retracing toward the 200-day moving average support. Earlier, this long-term moving average was the robust resistance for the index. Therefore, its support will be equally strong and reliable. In such a scenario, XLE is likely to get trapped in between the 50-day and the 200-day MA. The RSI (14) in Figure 2 is forming a falling wedge. Although the ADX line is showing a weak trend, the selling pressure is high compared to the buying pressure. The MACD (12,26,9) has declined in negative territory. Thus, the daily chart has a more bearish force. Though XLE can establish support in the next few sessions, the price rally would face 50-day MA resistance. Therefore, short-term trades are likely to get whipsawed in this tricky support-resistance zone. |
| The symmetrical triangle seen in Figure 1 would narrow further, and thus, narrowing the trading range. So it is advisable to trade with low volume between the support-resistance of 50-day and 200-day MAs (Figure 2). However, the breakout of symmetrical triangle would decide the future direction for XLE. Till then, traders should stay away from XLE. |
Active trader in the Indian stock markets since 2003 and a full-time writer. Trading is largely based upon technical analysis.
| Company: | Independent |
| Address: | C1/3 Parth Indraprasth Towers. Vastrapur |
| Ahmedabad, Guj 380015 | |
| E-mail address: | chaitalimohile@yahoo.co.in |
Traders' Resource Links | |
| Independent has not added any product or service information to TRADERS' RESOURCE. | |
Click here for more information about our publications!
PRINT THIS ARTICLE

Request Information From Our Sponsors
- StockCharts.com, Inc.
- Candle Patterns
- Candlestick Charting Explained
- Intermarket Technical Analysis
- John Murphy on Chart Analysis
- John Murphy's Chart Pattern Recognition
- John Murphy's Market Message
- MurphyExplainsMarketAnalysis-Intermarket Analysis
- MurphyExplainsMarketAnalysis-Visual Analysis
- StockCharts.com
- Technical Analysis of the Financial Markets
- The Visual Investor
- VectorVest, Inc.
- Executive Premier Workshop
- One-Day Options Course
- OptionsPro
- Retirement Income Workshop
- Sure-Fire Trading Systems (VectorVest, Inc.)
- Trading as a Business Workshop
- VectorVest 7 EOD
- VectorVest 7 RealTime/IntraDay
- VectorVest AutoTester
- VectorVest Educational Services
- VectorVest OnLine
- VectorVest Options Analyzer
- VectorVest ProGraphics v6.0
- VectorVest ProTrader 7
- VectorVest RealTime Derby Tool
- VectorVest Simulator
- VectorVest Variator
- VectorVest Watchdog
