HOT TOPICS LIST
- MACD
- Fibonacci
- RSI
- Gann
- ADXR
- Stochastics
- Volume
- Triangles
- Futures
- Cycles
- Volatility
- ZIGZAG
- MESA
- Retracement
- Aroon
INDICATORS LIST
LIST OF TOPICS
PRINT THIS ARTICLE
by Mike Carr, CMT
Over the long term, the US dollar has shown a tendency to peak several months ahead of peaks in the price of unleaded gas futures.
Position: Sell
Mike Carr, CMT
Mike Carr, CMT, is a member of the Market Technicians Association, and editor of the MTA's newsletter, Technically Speaking. He is also the author of "Smarter Investing in Any Economy: The Definitive Guide to Relative Strength Investing," and "Conquering the Divide: How to Use Economic Indicators to Catch Stock Market Trends."
PRINT THIS ARTICLE
TECHNICAL ANALYSIS
The Dollar Points To Cheaper Gas
04/05/12 08:49:51 AMby Mike Carr, CMT
Over the long term, the US dollar has shown a tendency to peak several months ahead of peaks in the price of unleaded gas futures.
Position: Sell
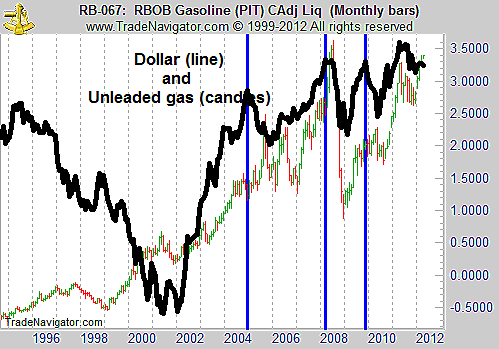
| Over the long term, the US dollar has shown a tendency to peak several months ahead of peaks in the price of unleaded gas futures. That relationship (Figure 1) could point to lower prices for consumers at the gas pump later this summer. However, before examining any intermarket relationship in detail, it is important to determine if there is a logical rationale to support the relationship. In the case of the dollar and gasoline, there does seem to be. Gasoline is produced from oil, and oil is a commodity that is traded on the international markets but usually priced in dollars. Because of that very close linkage, a rise in the dollar could make oil (and subsequently gasoline) more expensive. Declines in the dollar should also logically lead to an eventual decline in gasoline. The dollar should lead in this relationship. |

|
| FIGURE 1: GASOLINE, MONTHLY. The US dollar has led unleaded gasoline prices at significant turning points. |
| Graphic provided by: Trade Navigator. |
| |
| Several significant peaks in the dollar are highlighted with vertical bars in Figure 1. Gasoline futures peaked several months later in each case. The timing of the peak varies, and even the best market indicators will work with varying degrees of effectiveness, so some variability in a relationship like this should be expected. For consumers, the pump price fall is seen even later. The Energy Information Administration estimates that the futures markets leads retail gasoline prices, and they found that pump prices average about $0.70 more a gallon than spot futures prices. In early to mid-April, the futures price is about $3.40 and the average retail price is about $4, which shows that this estimated relationship is working for now. |

|
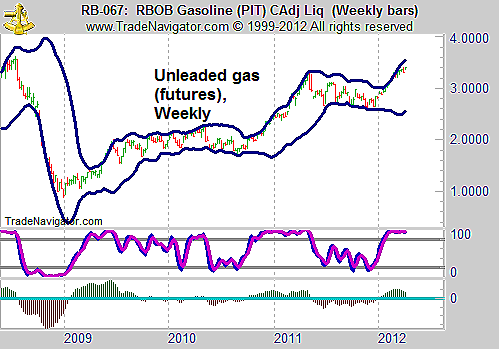
| FIGURE 2: GASOLINE, WEEKLY. Unleaded gas futures are showing signs of a possible price reversal, with overbought markets generally vulnerable to reversals. |
| Graphic provided by: Trade Navigator. |
| |
| After developing a higher-level perspective, traditional technical indicators can help a trader develop a more actionable market opinion. Multiple indicators should always be used and that method is applied in Figure 2, which shows that the price on the weekly chart is near its upper Bollinger Band, the stochastic indicator is severely overbought, and the moving average convergence/divergence (MACD) is bullish but declining. This market appears to be set up for a fall. |
| On the daily chart, stochastics and the MACD are showing bearish divergences. This adds to a bearish argument and indicates that unleaded gasoline is likely to confirm its historical trend of peaking several months after the dollar. With an intermarket relationship and multiple time frame analysis pointing toward a decline, consumers should be hopeful that the price they'll pay for gas in the summer vacation season should ease. Traders should wait for a break below about $3.20 a gallon on the futures market before taking short positions. |
| With the technical analysis completed, traders should not enter a trade until they consider risks that are not unique to the energy markets but are certainly more pronounced in oil and unleaded gas futures -- political risks. Nations in the oil-rich Middle East can be as volatile as the most volatile stocks, and that presents an unknown factor in these markets. Markets usually spike on significant events that involve the Middle East, a sign that traders don't know with any precision what will actually happen. There is no way to eliminate this risk, although risk management is very important on every trade and critical in leveraged futures trades. A money management stop is usually advisable in these markets. |
Mike Carr, CMT, is a member of the Market Technicians Association, and editor of the MTA's newsletter, Technically Speaking. He is also the author of "Smarter Investing in Any Economy: The Definitive Guide to Relative Strength Investing," and "Conquering the Divide: How to Use Economic Indicators to Catch Stock Market Trends."
| Website: | www.moneynews.com/blogs/MichaelCarr/id-73 |
| E-mail address: | marketstrategist@gmail.com |
Click here for more information about our publications!
Comments

Request Information From Our Sponsors
- StockCharts.com, Inc.
- Candle Patterns
- Candlestick Charting Explained
- Intermarket Technical Analysis
- John Murphy on Chart Analysis
- John Murphy's Chart Pattern Recognition
- John Murphy's Market Message
- MurphyExplainsMarketAnalysis-Intermarket Analysis
- MurphyExplainsMarketAnalysis-Visual Analysis
- StockCharts.com
- Technical Analysis of the Financial Markets
- The Visual Investor
- VectorVest, Inc.
- Executive Premier Workshop
- One-Day Options Course
- OptionsPro
- Retirement Income Workshop
- Sure-Fire Trading Systems (VectorVest, Inc.)
- Trading as a Business Workshop
- VectorVest 7 EOD
- VectorVest 7 RealTime/IntraDay
- VectorVest AutoTester
- VectorVest Educational Services
- VectorVest OnLine
- VectorVest Options Analyzer
- VectorVest ProGraphics v6.0
- VectorVest ProTrader 7
- VectorVest RealTime Derby Tool
- VectorVest Simulator
- VectorVest Variator
- VectorVest Watchdog
