HOT TOPICS LIST
- MACD
- Fibonacci
- RSI
- Gann
- ADXR
- Stochastics
- Volume
- Triangles
- Futures
- Cycles
- Volatility
- ZIGZAG
- MESA
- Retracement
- Aroon
INDICATORS LIST
LIST OF TOPICS
PRINT THIS ARTICLE
by Donald W. Pendergast, Jr.
Earnings are good and Caterpillar's long-term prospects appear to be bright, but cyclical analysis suggests that the stock may be due for a significant pullback in the near term.
Position: N/A
Donald W. Pendergast, Jr.
Donald W. Pendergast is a financial markets consultant who offers specialized services to stock brokers and high net worth individuals who seek a better bottom line for their portfolios.
PRINT THIS ARTICLE
CYCLES
CAT Jumps Down From Here?
04/05/12 12:07:57 PMby Donald W. Pendergast, Jr.
Earnings are good and Caterpillar's long-term prospects appear to be bright, but cyclical analysis suggests that the stock may be due for a significant pullback in the near term.
Position: N/A
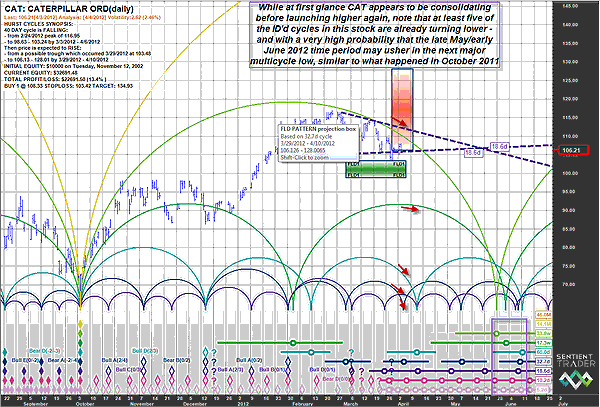
| Caterpillar (CAT), long a giant in the US manufacturing sector, is a large-cap stock that has a very high beta (1.85 versus the .SPX) compared to its parent index, the mighty Standard & Poor's 500. As such, it can offer enterprising swing traders numerous opportunities to time high-probability swing trade and covered-call setups that appear on a regular basis. Using price cycles analysis covering 10 years of historical daily data has uncovered the following repetitive price cycles in CAT: Weekly cycles: 33.8 and 17.3 Daily cycles: 60, 32.7, 18.6, 10.2, 5.2 When a significant number of these cycles are all predicted to form a cycle low (also known as a trough) in a particular time period, and if the majority of those cycles are already heading lower toward that expected low, it is usually unwise to put on new long positions in such a market, as powerful, repetitive cyclical forces would be at odds with such a bullish strategy. This is the case for CAT right now. The stock has excellent fundamentals and earnings growth prospects, but it has two main forces mitigating the prospect for any near-term rally potential: 1. The .SPX may already have made its final high of the incredible rally that launched six months ago and is now either in a trading range and/or ready to stage at least an 8% to 10% correction. 2. The 33.8- and 17.3-week cycles are already moving lower and the daily 60, 32.7, and 18.6 price cycles are also falling. Essentially, you don't want to be fighting such bearish forces by initiating a new long position in CAT until these dynamics have finally played out. See Figure 1. |

|
| FIGURE 1: CAT, DAILY. With five price cycles already turning down in CAT, going long now may not be the wisest nor safest course of action. Late May to early June 2012 may see the arrival of a significant multicycle low in this stock. |
| Graphic provided by: Sentient Trader. |
| |
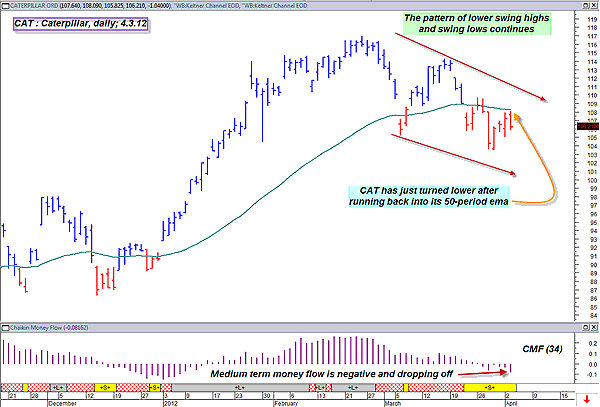
| One thing to watch for now is for CAT to drop down below the dashed blue trendline, quickly followed by a break below the March 29, 2012, swing low of 103.48. This 1-2 bearish punch could be the trigger for CAT to begin an accelerated decline into that anticipated late May-early June 2012 multicycle low mentioned earlier. With medium-term money flow (based on the 34-period Chaikin money flow histogram [CMF][34]) now negative and falling and the stock in a de facto downtrend (lower swing highs and lower swing lows), there appears to be plenty of bearish evidence to point to the possibility of further declines in this large-cap heavyweight (Figure 2). |

|
| FIGURE 2: CAT, DAILY. Bearish evidence for CAT includes an established downtrend in place, weak money flow, and a downsloping 50-period exponential moving average (EMA). The CS Scientific expert (yellow ribbon at bottom of chart) from MetaStock is also suggesting that CAT may be a good shorting opportunity. |
| Graphic provided by: MetaStock. |
| Graphic provided by: CS Scientific expert from MetaStock 11. |
| |
| Playing a decline in CAT might involve something as simple as buying at-the-money (ATM) puts with at least two to three months of time value -- but only if we get that two-stage decline below $103.45, of course. With the next significant support levels coming in at 98.00, 89.00, and then 86.00, those may be logical target prices for any such near-term option plays. Traders need to keep in mind the anticipated time window for the multicycle low in mind as well. |
Donald W. Pendergast is a financial markets consultant who offers specialized services to stock brokers and high net worth individuals who seek a better bottom line for their portfolios.
| Title: | Writer, market consultant |
| Company: | Linear Trading Systems LLC |
| Jacksonville, FL 32217 | |
| Phone # for sales: | 904-239-9564 |
| E-mail address: | lineartradingsys@gmail.com |
Traders' Resource Links | |
| Linear Trading Systems LLC has not added any product or service information to TRADERS' RESOURCE. | |
Click here for more information about our publications!
PRINT THIS ARTICLE

Request Information From Our Sponsors
- StockCharts.com, Inc.
- Candle Patterns
- Candlestick Charting Explained
- Intermarket Technical Analysis
- John Murphy on Chart Analysis
- John Murphy's Chart Pattern Recognition
- John Murphy's Market Message
- MurphyExplainsMarketAnalysis-Intermarket Analysis
- MurphyExplainsMarketAnalysis-Visual Analysis
- StockCharts.com
- Technical Analysis of the Financial Markets
- The Visual Investor
- VectorVest, Inc.
- Executive Premier Workshop
- One-Day Options Course
- OptionsPro
- Retirement Income Workshop
- Sure-Fire Trading Systems (VectorVest, Inc.)
- Trading as a Business Workshop
- VectorVest 7 EOD
- VectorVest 7 RealTime/IntraDay
- VectorVest AutoTester
- VectorVest Educational Services
- VectorVest OnLine
- VectorVest Options Analyzer
- VectorVest ProGraphics v6.0
- VectorVest ProTrader 7
- VectorVest RealTime Derby Tool
- VectorVest Simulator
- VectorVest Variator
- VectorVest Watchdog
