HOT TOPICS LIST
- MACD
- Fibonacci
- RSI
- Gann
- ADXR
- Stochastics
- Volume
- Triangles
- Futures
- Cycles
- Volatility
- ZIGZAG
- MESA
- Retracement
- Aroon
INDICATORS LIST
LIST OF TOPICS
PRINT THIS ARTICLE
by Donald W. Pendergast, Jr.
Shares of Hecla Mining made an important multicycle low on March 22, 2012, and are now attempting yet another move higher.
Position: N/A
Donald W. Pendergast, Jr.
Donald W. Pendergast is a financial markets consultant who offers specialized services to stock brokers and high net worth individuals who seek a better bottom line for their portfolios.
PRINT THIS ARTICLE
CYCLES
For Hecla Mining, A Rising Price Cycle?
04/05/12 08:35:40 AMby Donald W. Pendergast, Jr.
Shares of Hecla Mining made an important multicycle low on March 22, 2012, and are now attempting yet another move higher.
Position: N/A
| Gold and silver mining stocks are well known to be among the more volatile issues in the equities market, and few among the larger-cap mining stocks are more explosive than those of Hecla Mining (HL). If a trader can consistently manage to get on and stay on the right side of this stock, he or she should have little trouble in "mining" some profits here, especially if they use wise trade management and risk control strategies. Here's a look at the very convincing cycle low that HL made a couple of weeks ago, one that could lead to further upside for bulls in this legacy mining stock. |

|
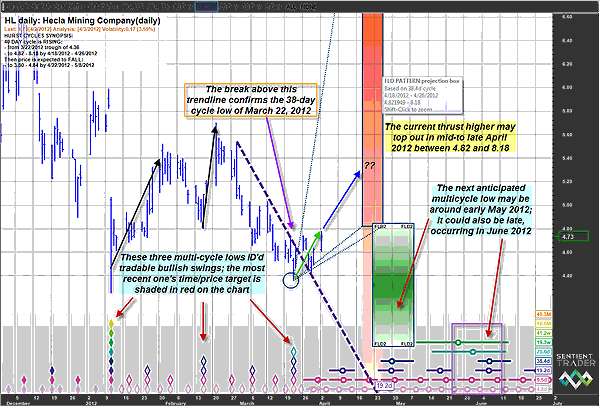
| FIGURE 1: HL, DAILY. Hecla Mining shares tend to make sharp, tradable swing moves; proper price cycle analysis may help traders and investors to stay on the right side of such moves -- most of the time. The stock is also notorious for staging major fakeout moves that can catch the unsuspecting trader off guard. |
| Graphic provided by: Sentient Trader. |
| |
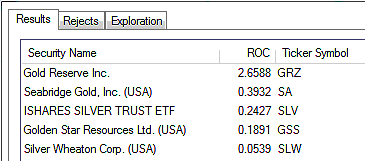
| With a beta of 2.03 (meaning it is 103% more volatile than the .SPX), shares of Hecla Mining really do tend to move around on the price chart (Figure 1). As you can see, there are times when it surges ahead in tradable swing moves and also times when it can chop about and even stage stunning fakeout reversals, all on very short notice. One of the more dependable ways to help determine if HL is due to make a significant, multicycle low is through the thoughtful use of price cycle analysis. If you can get a good, unbiased statistical analysis on this, then you may truly be able to turn such knowledge into trading profits. That said, let's look at three of the most prominent multicycle lows that Sentient Trader has identified since the first of the year. The first one occurred when eight separate price cycles all bottomed on January 10, 2012 (see the stack of colored diamonds in the lower portion of the chart); HL then proceeded to rally by 30% over the following three weeks. The next multicycle low occurred on February 16, 2012 (four separate cycles bottomed together), after which HL rallied by about 18% in just one week. More recently was the muticycle low (this time, five separate cycles) that bottomed out on March 22, 2012. So far, HL is up by about 8%. Clearly, having at least some working knowledge of price cycles can be put to good use in the day-to-day analysis regimen of most traders and investors. As it stands now, the software is projecting a further rise by HL either toward or into the red shaded time/price projection box, calling for the stock to rise to at least 4.82 and possibly as high as 8.18 between April 18 and April 26, 2012. The fact that HL has clearly broken above its 19.2-day valid trendline (VTL; see the dashed dark blue downtrend line) has also confirmed that the stock's 38.4-day price cycle low was indeed made on March 22, 2012, which is yet another bit of bullish evidence. That the .SPX made another high (in the current rally that launched on October 4, 2011) on Monday April 2, 2012, also would bode well for HL as it seeks to make an attempt for higher ground once again. See Figure 2. |

|
| FIGURE 2: MINING SHARES. There are only a handful of liquid gold/silver mining shares (plus the major silver exchange traded fund) that are actually outperforming the .SPX over the last 13 weeks. |
| Graphic provided by: MetaStock. |
| Graphic provided by: MetaStock Explorer. |
| |
| Also identified on the chart is the next multicycle time/price projection box, which appears to be due sometime between late April and early May 2012; the maximum anticipated low is near 4.00. I have also taken the liberty of identifying a slightly later group of cycles set to bottom out in late May to early June 2012; there are several higher-degree cycles due at this later date than the one identified by the green box, so if the low isn't made then, look for a major low in late May to early June 2012 instead. Cycles analysis can be a wonderful tool, but cycles can and do expand/contract without warning, meaning that a sharp technician must always use a variety of other technical and fundamental tools in addition to that of price cycle analysis. So, for now, the line of least resistance in HL appears to be higher, especially if the broad markets continue to grind ever higher. |
Donald W. Pendergast is a financial markets consultant who offers specialized services to stock brokers and high net worth individuals who seek a better bottom line for their portfolios.
| Title: | Writer, market consultant |
| Company: | Linear Trading Systems LLC |
| Jacksonville, FL 32217 | |
| Phone # for sales: | 904-239-9564 |
| E-mail address: | lineartradingsys@gmail.com |
Traders' Resource Links | |
| Linear Trading Systems LLC has not added any product or service information to TRADERS' RESOURCE. | |
Click here for more information about our publications!
PRINT THIS ARTICLE

Request Information From Our Sponsors
- StockCharts.com, Inc.
- Candle Patterns
- Candlestick Charting Explained
- Intermarket Technical Analysis
- John Murphy on Chart Analysis
- John Murphy's Chart Pattern Recognition
- John Murphy's Market Message
- MurphyExplainsMarketAnalysis-Intermarket Analysis
- MurphyExplainsMarketAnalysis-Visual Analysis
- StockCharts.com
- Technical Analysis of the Financial Markets
- The Visual Investor
- VectorVest, Inc.
- Executive Premier Workshop
- One-Day Options Course
- OptionsPro
- Retirement Income Workshop
- Sure-Fire Trading Systems (VectorVest, Inc.)
- Trading as a Business Workshop
- VectorVest 7 EOD
- VectorVest 7 RealTime/IntraDay
- VectorVest AutoTester
- VectorVest Educational Services
- VectorVest OnLine
- VectorVest Options Analyzer
- VectorVest ProGraphics v6.0
- VectorVest ProTrader 7
- VectorVest RealTime Derby Tool
- VectorVest Simulator
- VectorVest Variator
- VectorVest Watchdog
