HOT TOPICS LIST
- MACD
- Fibonacci
- RSI
- Gann
- ADXR
- Stochastics
- Volume
- Triangles
- Futures
- Cycles
- Volatility
- ZIGZAG
- MESA
- Retracement
- Aroon
INDICATORS LIST
LIST OF TOPICS
PRINT THIS ARTICLE
by Mike Carr, CMT
After a strong run, the stock market looks toppy to some. However, by many measures this seems like the start of a new bull market.
Position: Buy
Mike Carr, CMT
Mike Carr, CMT, is a member of the Market Technicians Association, and editor of the MTA's newsletter, Technically Speaking. He is also the author of "Smarter Investing in Any Economy: The Definitive Guide to Relative Strength Investing," and "Conquering the Divide: How to Use Economic Indicators to Catch Stock Market Trends."
PRINT THIS ARTICLE
REL. STR OSCILL
Rising Tides Lift All Boats (And Sectors)
04/05/12 08:21:36 AMby Mike Carr, CMT
After a strong run, the stock market looks toppy to some. However, by many measures this seems like the start of a new bull market.
Position: Buy
| Stocks started 2012 with the best first quarter in years, and that brings out the bears. Marketers seem to prefer selling doom and gloom rather than optimism. While many headlines have explained why the market must fall, prices have been going up. In fact, over the past six months all market sectors are showing a gain. This is consistent with the way the market behaves at the beginning of a bull market. The gains since October follow a decline of about 20% in the major market indexes that occurred last summer. While brief, that decline was a bear market and the first year of a new bull market usually offers exceptional returns. The strongest sectors (Figure 1) over the past six months have been computer hardware and financials. Technology is a favorite sector of speculators, and leadership of speculative stocks in the past has been critical to a healthy bull market. Financials are an important sector that reflects strength in the economy and in the markets. The 2008-09 bear market was preceded by weakness in financials, which highlighted how the housing bubble was about to unravel in the economy and how the financial markets were going to suffer losses because of the poor performance of mortgage-backed securities, which would suffer along with home prices. |

|
| FIGURE 1: SECTORS. Tech stocks are the best performers, a sign of a strong bull market. |
| Graphic provided by: Trade Navigator. |
| |
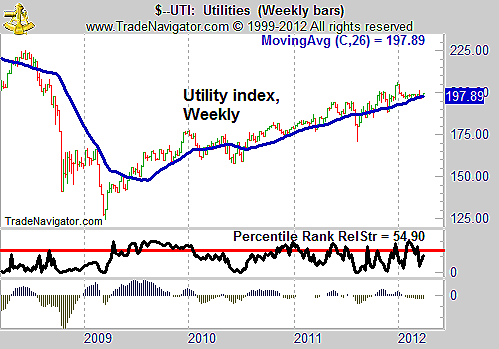
| Most traders will scan the market leaders to find potential winning trades. That is most likely the best way to find winning stocks. But when analyzing the market, looking at the laggards can be helpful. Over the past 26 weeks, utilities have been the weakest-performing sector. Despite being the weakest, the index is still up over that time frame and the chart is bullish (Figure 2). |

|
| FIGURE 2: UTILITIES, WEEKLY. Utilities are consolidating recent gains and seem ready to move higher. |
| Graphic provided by: Trade Navigator. |
| |
| On the weekly chart, utilities show a price consolidation pattern within a small uptrend. Interestingly, the relative strength measured against all other stocks and market indexes is pointing higher. This could indicate that a rotation toward defensive issues is likely after the initial move higher in this stock market trend. Although the moving average convergence/divergence (MACD), shown in the lower part of Figure 2, is bearish, it is moving upward and has reached a relatively low degree of bearishness. |
| Many traders are familiar with the "Investor's Business Daily" CANSLIM trading strategy. The "M" in that acronym stands for "market," and there are many ways to identify whether the overall market is going up or down. CANSLIM is a strategy that works very well, and the truth is that almost any strategy works well if it is followed in a disciplined manner. But there are at least a few traders who fight what they see, wanting to make the market conform to their biases rather than trading what the market offers. |
| The current stock market is above significant moving averages and traditional technical indicators are all bullish. That is a sign the market is bullish. The fact that the rising tide of the market is currently lifting all boats may be the most bullish indicator possible. A reaction would not be unheard of after a gain of more than 20% in about six months. Like utilities, defensive stocks can offer a safe bet in a reaction, and traders who have uncommitted cash should consider this sector as an option to gain at least limited equity exposure rather than continuing to hold cash in a new bull market. |
Mike Carr, CMT, is a member of the Market Technicians Association, and editor of the MTA's newsletter, Technically Speaking. He is also the author of "Smarter Investing in Any Economy: The Definitive Guide to Relative Strength Investing," and "Conquering the Divide: How to Use Economic Indicators to Catch Stock Market Trends."
| Website: | www.moneynews.com/blogs/MichaelCarr/id-73 |
| E-mail address: | marketstrategist@gmail.com |
Click here for more information about our publications!
Comments
Date: 04/10/12Rank: 5Comment:

Request Information From Our Sponsors
- VectorVest, Inc.
- Executive Premier Workshop
- One-Day Options Course
- OptionsPro
- Retirement Income Workshop
- Sure-Fire Trading Systems (VectorVest, Inc.)
- Trading as a Business Workshop
- VectorVest 7 EOD
- VectorVest 7 RealTime/IntraDay
- VectorVest AutoTester
- VectorVest Educational Services
- VectorVest OnLine
- VectorVest Options Analyzer
- VectorVest ProGraphics v6.0
- VectorVest ProTrader 7
- VectorVest RealTime Derby Tool
- VectorVest Simulator
- VectorVest Variator
- VectorVest Watchdog
- StockCharts.com, Inc.
- Candle Patterns
- Candlestick Charting Explained
- Intermarket Technical Analysis
- John Murphy on Chart Analysis
- John Murphy's Chart Pattern Recognition
- John Murphy's Market Message
- MurphyExplainsMarketAnalysis-Intermarket Analysis
- MurphyExplainsMarketAnalysis-Visual Analysis
- StockCharts.com
- Technical Analysis of the Financial Markets
- The Visual Investor
