HOT TOPICS LIST
- MACD
- Fibonacci
- RSI
- Gann
- ADXR
- Stochastics
- Volume
- Triangles
- Futures
- Cycles
- Volatility
- ZIGZAG
- MESA
- Retracement
- Aroon
INDICATORS LIST
LIST OF TOPICS
PRINT THIS ARTICLE
by Koos van der Merwe
When times are tough, an auctioneer can be your best friend.
Position: Accumulate
Koos van der Merwe
Has been a technical analyst since 1969, and has worked as a futures and options trader with First Financial Futures in Johannesburg, South Africa.
PRINT THIS ARTICLE
CUP WITH HANDLE
Ritchie Brothers Auctioneers
04/05/12 08:07:45 AMby Koos van der Merwe
When times are tough, an auctioneer can be your best friend.
Position: Accumulate
| Ritchie Bros. Auctioneers (RBA) is probably the world's largest industrial auctioneer, conducting hundreds of public auctions around the world every year. Yes, they are busy, especially when an economy starts recovering, and businesses are looking to purchase and replace equipment they may have sold when times were tough. |

|
| FIGURE 1: RITCHIE BROTHERS, WEEKLY |
| Graphic provided by: OmniTrader. |
| |
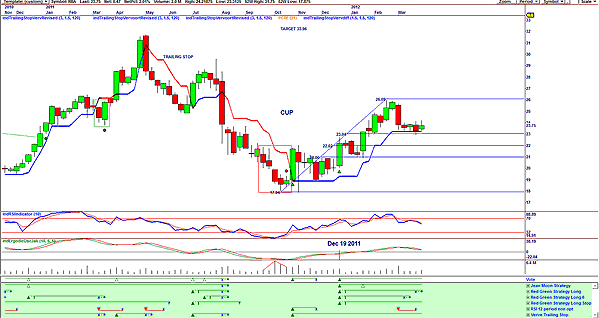
| Figure 1 is a weekly chart and shows the cup & handle formation that is developing. A Fibonacci retracement shows that the price has fallen to the 32.8% level, at $23.25. The price could retrace from this level and give a buy signal by breaking above $26.05, the handle. This would suggest a move to the target of $33.96 (26.04 -18.12 = 7.92 + 26.04 = 33.96). The vote line shows that a buy signal was given on December 19, 2011. The vote line is a summation of the strategies shown in green. The vote line is used to suggest buy signals. Sell signals are given by the trailing stop. The negatives are the relative strength index (RSI), which is falling, and the ergodic oscillator. Should the price fall below the 32.8% support level of $23.07, it should find support at $22.08, the 50% level. |

|
| FIGURE 2: RITCHIE BROTHERS, DAILY |
| Graphic provided by: OmniTrader. |
| |
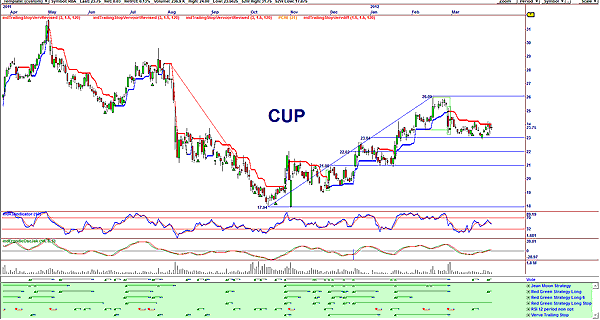
| Figure 2 is a daily chart, showing the cup that has formed, with the handle at $26.09. The vote line in the daily chart has given a buy signal, based on the strategy of RSI (12 period) on top of the red-green strategy with a long stop. The RSI, a 10 period, has given a buy signal. The ergodic oscillator is also suggesting a buy signal. I would be a buyer of Ritchie Brothers as a short-term buy as the price rises to possibly test the $26.09 price level. I would sell if the price were to break below the trailing stop. |
Has been a technical analyst since 1969, and has worked as a futures and options trader with First Financial Futures in Johannesburg, South Africa.
| Address: | 3256 West 24th Ave |
| Vancouver, BC | |
| Phone # for sales: | 6042634214 |
| E-mail address: | petroosp@gmail.com |
Click here for more information about our publications!
PRINT THIS ARTICLE

Request Information From Our Sponsors
- VectorVest, Inc.
- Executive Premier Workshop
- One-Day Options Course
- OptionsPro
- Retirement Income Workshop
- Sure-Fire Trading Systems (VectorVest, Inc.)
- Trading as a Business Workshop
- VectorVest 7 EOD
- VectorVest 7 RealTime/IntraDay
- VectorVest AutoTester
- VectorVest Educational Services
- VectorVest OnLine
- VectorVest Options Analyzer
- VectorVest ProGraphics v6.0
- VectorVest ProTrader 7
- VectorVest RealTime Derby Tool
- VectorVest Simulator
- VectorVest Variator
- VectorVest Watchdog
- StockCharts.com, Inc.
- Candle Patterns
- Candlestick Charting Explained
- Intermarket Technical Analysis
- John Murphy on Chart Analysis
- John Murphy's Chart Pattern Recognition
- John Murphy's Market Message
- MurphyExplainsMarketAnalysis-Intermarket Analysis
- MurphyExplainsMarketAnalysis-Visual Analysis
- StockCharts.com
- Technical Analysis of the Financial Markets
- The Visual Investor
