HOT TOPICS LIST
- MACD
- Fibonacci
- RSI
- Gann
- ADXR
- Stochastics
- Volume
- Triangles
- Futures
- Cycles
- Volatility
- ZIGZAG
- MESA
- Retracement
- Aroon
INDICATORS LIST
LIST OF TOPICS
PRINT THIS ARTICLE
by Koos van der Merwe
You receive a buy signal on a stock. Do you analyze some more or just go ahead and buy?
Position: Accumulate
Koos van der Merwe
Has been a technical analyst since 1969, and has worked as a futures and options trader with First Financial Futures in Johannesburg, South Africa.
PRINT THIS ARTICLE
REL. STR COMPARATIVE
Analyzing Sirius Satellite Radio
04/04/12 08:54:21 AMby Koos van der Merwe
You receive a buy signal on a stock. Do you analyze some more or just go ahead and buy?
Position: Accumulate
| Using an analytical program to identify stocks that are suggesting buy/short signals is pretty easy once you have established parameters and strategies that suggest high profitability. There is a "but," however; what happens if you analyze and analyze, just to be certain? Here's an example. |

|
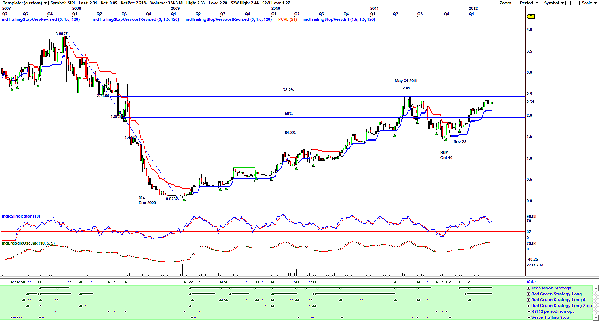
| FIGURE 1: SIRI, WEEKLY |
| Graphic provided by: OmniTrader. |
| |
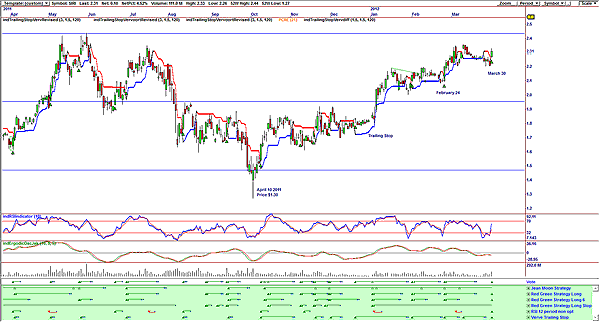
| To analyze the market, I use OmniTrader because it allows me to prepare a strategy that when tested gives me good profitability. Looking at Figure 1, you can see the various strategies I have written. Summing them up gives me a buy signal in the vote line. In this chart, every single strategy is in buy mode, a positive sign. A look at the vote line shows buy signals from April 10, 2011, when the price was $1.30. Sell signals were given when the price broke below the trailing stop. So I would buy on the vote line and sell every time the trailing stop was broken. My profit would have been very comfortable. The program has given me a new buy signal. Instead of just taking the plunge, I want to check it out, so I will look at a weekly chart. |

|
| FIGURE 2: SIRI, DAILY |
| Graphic provided by: OmniTrader. |
| |
| The weekly chart in Figure 2 shows how the price dropped to 11 cents by December 2009, a dramatic drop. Since then, the price has risen steadily. Drawing a Fibonacci retracement over the period of the drop, you can see how the price recovered to $2.41, the 38.2% Fibonacci level. It then dropped, testing the 50% level, recovered and then broke through it to the 61.8% level at $1.50. It then gave a buy signal on October 10 and reinforced it with a second buy signal on November 28. The question, of course, is whether the share price will rise to retest the 61.8% at $2.41. Will it then give a sell signal, or will it penetrate it and continue rising? Do note that the relative strength index (RSI)(10 period) has given a sell signal. A look at previous signals shows that whenever an RSI sell signal was given, the share price seemed to pause and move sideways, rather than stall dramatically, with the exception of the RSI sell signal given on May 31, 2011. However, our strategy is to sell only when the trailing stop is penetrated. I would be a buyer of SIRI at present levels, knowing that the possibility of a correction could occur at the $2.41 level. The weekly chart suggests that the risk is worth it because should it break above that level, it could rise to $3.94, the high of March 2007. |
Has been a technical analyst since 1969, and has worked as a futures and options trader with First Financial Futures in Johannesburg, South Africa.
| Address: | 3256 West 24th Ave |
| Vancouver, BC | |
| Phone # for sales: | 6042634214 |
| E-mail address: | petroosp@gmail.com |
Click here for more information about our publications!
PRINT THIS ARTICLE

Request Information From Our Sponsors
- StockCharts.com, Inc.
- Candle Patterns
- Candlestick Charting Explained
- Intermarket Technical Analysis
- John Murphy on Chart Analysis
- John Murphy's Chart Pattern Recognition
- John Murphy's Market Message
- MurphyExplainsMarketAnalysis-Intermarket Analysis
- MurphyExplainsMarketAnalysis-Visual Analysis
- StockCharts.com
- Technical Analysis of the Financial Markets
- The Visual Investor
- VectorVest, Inc.
- Executive Premier Workshop
- One-Day Options Course
- OptionsPro
- Retirement Income Workshop
- Sure-Fire Trading Systems (VectorVest, Inc.)
- Trading as a Business Workshop
- VectorVest 7 EOD
- VectorVest 7 RealTime/IntraDay
- VectorVest AutoTester
- VectorVest Educational Services
- VectorVest OnLine
- VectorVest Options Analyzer
- VectorVest ProGraphics v6.0
- VectorVest ProTrader 7
- VectorVest RealTime Derby Tool
- VectorVest Simulator
- VectorVest Variator
- VectorVest Watchdog
