HOT TOPICS LIST
- MACD
- Fibonacci
- RSI
- Gann
- ADXR
- Stochastics
- Volume
- Triangles
- Futures
- Cycles
- Volatility
- ZIGZAG
- MESA
- Retracement
- Aroon
INDICATORS LIST
LIST OF TOPICS
PRINT THIS ARTICLE
by Donald W. Pendergast, Jr.
Up by nearly 44% since late December 2011, shares of BRCM now appear ready to attempt yet another surge higher.
Position: N/A
Donald W. Pendergast, Jr.
Donald W. Pendergast is a financial markets consultant who offers specialized services to stock brokers and high net worth individuals who seek a better bottom line for their portfolios.
PRINT THIS ARTICLE
MOVING AVERAGES
BRCM Ready To Rock Again?
04/04/12 10:18:38 AMby Donald W. Pendergast, Jr.
Up by nearly 44% since late December 2011, shares of BRCM now appear ready to attempt yet another surge higher.
Position: N/A
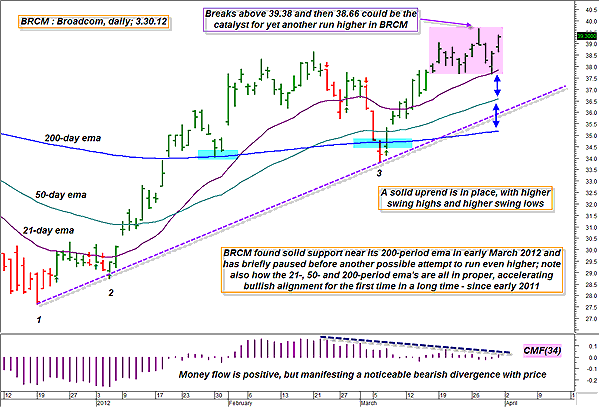
| Broadcom (BRCM), once one of the dotcom darlings of the mid- to late 1990s, has morphed into a very solid tech giant whose stock is a staple in many institutional portfolios. While it doesn't make as many giant trending moves nowadays -- mostly because its opportunity for exponentially large increases in earnings potential is long gone -- it is still a very tradable stock, one that makes many respectable swing moves that savvy, experienced traders can be expected to regularly capitalize on. Here's a closer look at an interesting long trade setup that may be about to trigger in this tech giant's stock (see Figure 1). |

|
| FIGURE 1: BRCM, DAILY. A break above the pink-shaded area could lead to another surge higher in shares of Broadcom. While the trend and momentum characteristics of this stock are excellent, wise traders will also want to be aware of the bearish price/money flow divergence on the stock's daily chart. |
| Graphic provided by: MetaStock. |
| |
| There are three moving averages that can be very useful for traders and investors seeking to determine two valuable pieces of technical evidence, which are: 1. Potential entry areas after a major support test 2. The trend strength of a given market. There are several examples that could be good for newer traders to examine. First, note the two blue shaded boxes that straddle the 200-day exponential moving average (EMA): note how after the initial surge above it in mid-January 2012 was followed by a successful test of this critical long-term average just two weeks later. The market trended higher for the next three weeks or so before gradually pulling back again in March 2012, this time mildly overshooting the same 200-day EMA. This pullback also allowed the uptrend line that began at the December 2011 low to be further extended, confirming the powerful trend. Investors and traders once again piled into the stock, driving it sharply higher once again. The big lesson is to always be aware of the 200-day EMA (or its simple moving average cousin) and how price action responds when such a vital support/resistance line is touched and/or approached. You also need to be aware of major trendlines and key swing highs/lows and attempt to put all of this together in a way that helps you understand where the line of least resistance (one of Jesse Livermore's key market dynamic concepts) lies. The second dynamic is the actual relationship between the 21-, 50-, and 200-day EMAs themselves. Simply put, you always want to try to initiate moves when the 21-day EMA is rising, even as it is accelerating higher from the 50-day EMA and the 50-day EMA is accelerating higher from the 200-day EMA. This is the exact situation that exists on BRCM's daily chart right now; all three EMAs are sloping upward, with the shorter averages each accelerating higher. With a minor consolidation pattern evident on BRCM's daily chart, the entry trigger is dirt-simple, meaning that serious traders should be all over this stock on a breakout of the pink-shaded area above the 39.38 and 39.66 areas. |
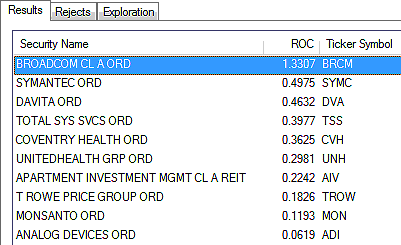
| There is no guarantee that such a long entry will produce a profit, but at the very least, all of the forces of long-term trend and near-term momentum will be firmly on the side of the trader deciding to enter long on a further break to the upside. As far as managing such a potential long entry, a two- to three-bar trailing stop of the daily lows should do the job as well as most other kinds of trailing stops and may help to lock in any gains while minimizing the damage if the stock decides to turn lower shortly after trade initiation. Risking no more than 1% to 2% of trading capital is also an excellent idea, one that Livermore (and every other trader who has ever made a fortune in the market before losing it and then ultimately recovering it again) would no doubt voice hearty approval of. Limit your risk and thus limit your market heartaches; it's really that basic (Figure 2). |

|
| FIGURE 2: LARGE-CAP STOCKS. Ten large-cap stocks outperforming the .SPX over the last calendar quarter. |
| Graphic provided by: MetaStock. |
| Graphic provided by: MetaStock Explorer. |
| |
Donald W. Pendergast is a financial markets consultant who offers specialized services to stock brokers and high net worth individuals who seek a better bottom line for their portfolios.
| Title: | Writer, market consultant |
| Company: | Linear Trading Systems LLC |
| Jacksonville, FL 32217 | |
| Phone # for sales: | 904-239-9564 |
| E-mail address: | lineartradingsys@gmail.com |
Traders' Resource Links | |
| Linear Trading Systems LLC has not added any product or service information to TRADERS' RESOURCE. | |
Click here for more information about our publications!
PRINT THIS ARTICLE

Request Information From Our Sponsors
- StockCharts.com, Inc.
- Candle Patterns
- Candlestick Charting Explained
- Intermarket Technical Analysis
- John Murphy on Chart Analysis
- John Murphy's Chart Pattern Recognition
- John Murphy's Market Message
- MurphyExplainsMarketAnalysis-Intermarket Analysis
- MurphyExplainsMarketAnalysis-Visual Analysis
- StockCharts.com
- Technical Analysis of the Financial Markets
- The Visual Investor
- VectorVest, Inc.
- Executive Premier Workshop
- One-Day Options Course
- OptionsPro
- Retirement Income Workshop
- Sure-Fire Trading Systems (VectorVest, Inc.)
- Trading as a Business Workshop
- VectorVest 7 EOD
- VectorVest 7 RealTime/IntraDay
- VectorVest AutoTester
- VectorVest Educational Services
- VectorVest OnLine
- VectorVest Options Analyzer
- VectorVest ProGraphics v6.0
- VectorVest ProTrader 7
- VectorVest RealTime Derby Tool
- VectorVest Simulator
- VectorVest Variator
- VectorVest Watchdog
