HOT TOPICS LIST
- MACD
- Fibonacci
- RSI
- Gann
- ADXR
- Stochastics
- Volume
- Triangles
- Futures
- Cycles
- Volatility
- ZIGZAG
- MESA
- Retracement
- Aroon
INDICATORS LIST
LIST OF TOPICS
PRINT THIS ARTICLE
by Koos van der Merwe
The rule is, when everyone is buying, that is the time to sell.
Position: Sell
Koos van der Merwe
Has been a technical analyst since 1969, and has worked as a futures and options trader with First Financial Futures in Johannesburg, South Africa.
PRINT THIS ARTICLE
RSI
Tips From TV About COST
04/03/12 08:34:22 AMby Koos van der Merwe
The rule is, when everyone is buying, that is the time to sell.
Position: Sell
| When a tip is given on one of the TV programs covering the stock market, you know that it is time to sell that stock. On Friday, March 30, one of the three programs I watch over the trading day tipped Costco (COST) as a buy. It does make sense that as the economy recovers, people will spend more on the purchases, so companies like Costco must show an increase in sales, hence profitability. But is it the right time to buy Costco? |

|
| FIGURE 1: COST, MONTHLY |
| Graphic provided by: AdvancedGET. |
| |
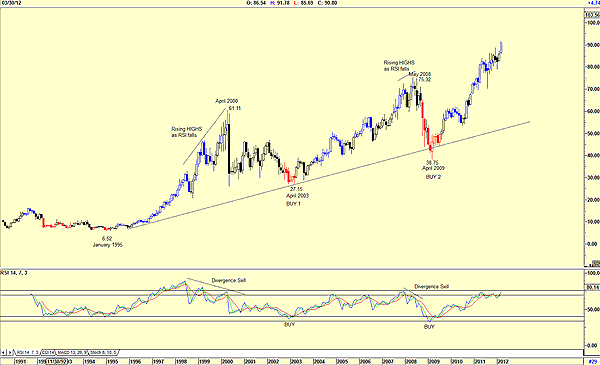
| Figure 1 is a monthly chart and shows how the price rose from a low of $6.52 in January 1995 to its present price of $90.80. Yes, the price did fall along with the technology market crash of 2000 to a low of $27.15 by April 2003. It then recovered to a high of $75.32 and followed the market once more with the financial crash of 2008 to a low of $38.75 by April 2009. In both instances, the relative strength index (RSI) suggested a buy as the RSI fell below the 32 line and then rose and penetrated it. Note also that the sell signals of April 2003 and May 2008 were given on RSI divergence sell signals. A divergence sell signal is given when the price rises but the RSI is falling. At the moment, the chart is suggesting a possible sell signal in the very near future, simply because the RSI is at overbought levels. However, should history repeat itself, the price could still rise, as the RSI falls in a divergence sell. |

|
| FIGURE 2: COST, WEEKLY |
| Graphic provided by: AdvancedGET. |
| |
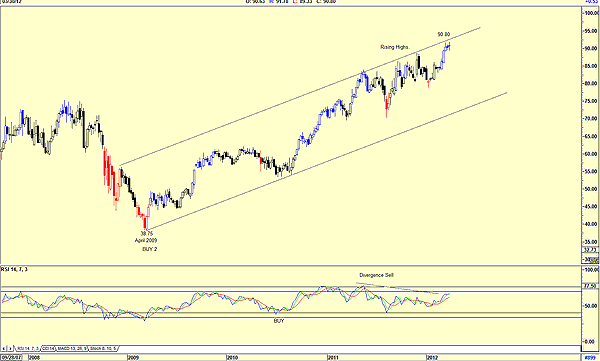
| Figure 2 is a weekly chart of COST, showing how the price rose from April 2009 on a RSI buy signal to its present high of $90.80. The problem facing us is once again the RSI, which has made lower highs as the price rose, suggesting a divergence sell signal in the offing. Note also that the price is tracking the upper resistance line. |

|
| FIGURE 3: COST, DAILY |
| Graphic provided by: AdvancedGET. |
| |
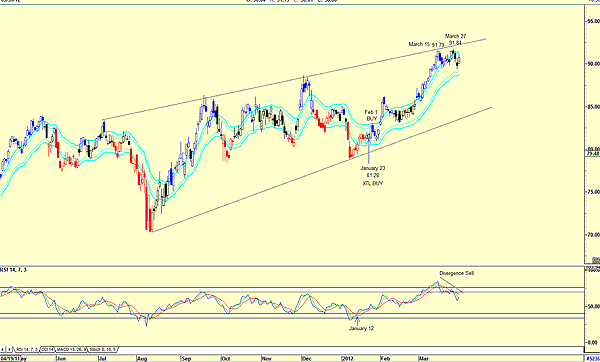
| Figure 3 is a daily chart and shows that the price rose from a high of $91.79 on March 15 to $91.84 by March 27, but the RSI once again fell, giving a divergence sell signal. Note that the price did give a buy signal on January 23 at $81.28 with the XTL buy. The XTL is a simple but powerful tool that is not complicated to use. If the bars are blue, then the trend is up. If the bars are red, then the trend is down. When you have a bar turn from red to black, it is suggesting a future buy and when it turns to blue, a confirmed buy. As you can see, the price color turned black on January 23, with a buy signal given the following day as the price color of the bar turned blue. On February 1, the buy signal was confirmed as the price broke out of the JM internal band. Traders would have bought on January 12 as the RSI signal gave a buy even though the XTL colors of the bar was still red. On March 27, at 91.84, the color of the bar changed from blue to black, suggesting that a sell signal should occur in the near future. Once again, traders would take profits on the divergence sell signal given by the RSI. Investors could wait for the bar color to change to red, or for the price to break below the lower band of the JM internal band indicator. It appears that any tip giving a buy on one of the TV financial channels should be analyzed thoroughly. Someone out there may be trying to get rid of stock they own at a good price. |
Has been a technical analyst since 1969, and has worked as a futures and options trader with First Financial Futures in Johannesburg, South Africa.
| Address: | 3256 West 24th Ave |
| Vancouver, BC | |
| Phone # for sales: | 6042634214 |
| E-mail address: | petroosp@gmail.com |
Click here for more information about our publications!
PRINT THIS ARTICLE

Request Information From Our Sponsors
- VectorVest, Inc.
- Executive Premier Workshop
- One-Day Options Course
- OptionsPro
- Retirement Income Workshop
- Sure-Fire Trading Systems (VectorVest, Inc.)
- Trading as a Business Workshop
- VectorVest 7 EOD
- VectorVest 7 RealTime/IntraDay
- VectorVest AutoTester
- VectorVest Educational Services
- VectorVest OnLine
- VectorVest Options Analyzer
- VectorVest ProGraphics v6.0
- VectorVest ProTrader 7
- VectorVest RealTime Derby Tool
- VectorVest Simulator
- VectorVest Variator
- VectorVest Watchdog
- StockCharts.com, Inc.
- Candle Patterns
- Candlestick Charting Explained
- Intermarket Technical Analysis
- John Murphy on Chart Analysis
- John Murphy's Chart Pattern Recognition
- John Murphy's Market Message
- MurphyExplainsMarketAnalysis-Intermarket Analysis
- MurphyExplainsMarketAnalysis-Visual Analysis
- StockCharts.com
- Technical Analysis of the Financial Markets
- The Visual Investor
