HOT TOPICS LIST
- MACD
- Fibonacci
- RSI
- Gann
- ADXR
- Stochastics
- Volume
- Triangles
- Futures
- Cycles
- Volatility
- ZIGZAG
- MESA
- Retracement
- Aroon
INDICATORS LIST
LIST OF TOPICS
PRINT THIS ARTICLE
by Donald W. Pendergast, Jr.
For a large-cap stock, Freeport McMoran can really make some aggressive moves. Will its latest slide soon find meaningful support near $34?
Position: N/A
Donald W. Pendergast, Jr.
Donald W. Pendergast is a financial markets consultant who offers specialized services to stock brokers and high net worth individuals who seek a better bottom line for their portfolios.
PRINT THIS ARTICLE
CYCLES
FCX Sliding Toward A Bottom?
04/02/12 09:41:08 AMby Donald W. Pendergast, Jr.
For a large-cap stock, Freeport McMoran can really make some aggressive moves. Will its latest slide soon find meaningful support near $34?
Position: N/A
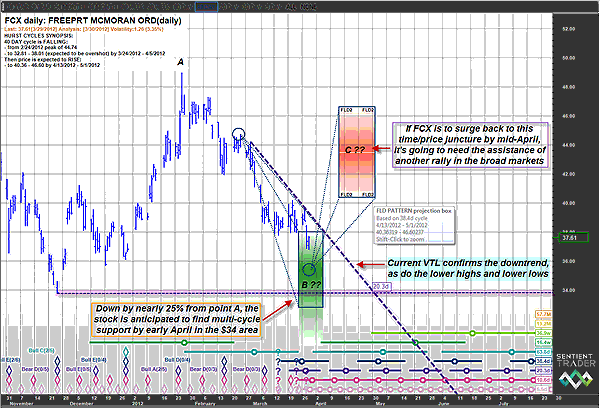
| If you are a fan of high-beta, high-yield stocks that can and do frequently embark on sustainable swing moves on a regular basis, then the common stock of Freeport-McMoran Copper and Gold, Inc. (FCX), based in Phoenix, AZ, may be one of your preferred trading vehicles. The stock has sold off by nearly 25% since January 26, 2012; it may be making its final approach into a series of cycle lows that could offer bulls an opportunity to take another shot at the long side in this heavyweight issue in the metals mining industry. Here's a closer look now (Figure 1). |

|
| FIGURE 1: FCX, DAILY. It can be a real temptation for inexperienced traders to call the exact low in a given market swing, but experienced traders have already learned (usually the hard way) that it's best to wait until a low has been confirmed before rushing headlong into a new position. Once the dashed blue downtrend line is taken out, putting on new long positions will be a safer proposition than by attempting to buy now. |
| Graphic provided by: Sentient Trader. |
| |
| While it's always fun to assume that after a 25% decline from a major swing high that a stock has simply fallen too much, wise traders know that you have to look at and then evaluate numerous pieces of technical and fundamental data before chiseling any kind of market analysis conclusions into stone. In the case of FCX, we find that the stock is off substantially from its late January 2012 high and that it is projected to make a swing low sometime soon -- perhaps by early April 2012. The green time/price projection box indicates that the stock may go as low as 32.80 and that it has already entered into the upper range of the projection area. Long-term money flow in the stock is heavily bearish, per the 100-period Chaikin money flow histogram (CMF)(100), and since there appears to be no meaningful positive price/money flow divergence at this point, the probabilities still favor FCX falling even more before a strong cyclical turn can be expected (minor bounces aside, of course). On the chart you see the pink shaded dashed line that identifies a powerful chart support area -- the November 25, 2011, swing low of 33.70 -- which is very likely to be tested before this major swing move south terminates. There is also strong chart support near 36.05, which could also provide a foundation for a series of multicycle lows by early April 2012. |

|
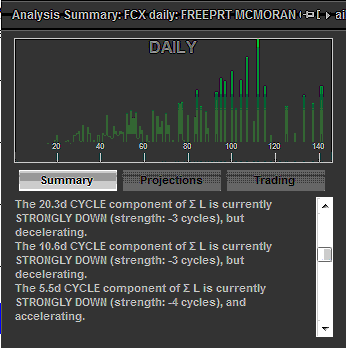
| FIGURE 2: FCX, ANALYSIS SUMMARY. With three of FCX's near-term cycles all in a strongly down phase, there is as yet no indication that a cyclical low has been made. |
| Graphic provided by: Sentient Trader. |
| |
| An interesting tool in Sentient Trader is the "Analysis Summary Panel" (Figure 2), which can help provide a quick text synopsis of the direction of all the important cycles identified on the stock or exchange traded fund (ETF) under review. In the case of FCX, we find that the 20.3- and 10.6-day cycles are both trending strongly lower and are decelerating, while the 5.5-day cycle is strongly down and is accelerating. According to that evaluation, this is probably not the time to be getting too aggressive with new long positions in FCX, especially with three near-term cycles all in the strongly down phase. However, for those who are experienced at scale trading, the use of such a tool could provide some guidance with knowing how/when to begin scaling into a long position in anticipation of an upcoming turn at a significant multicycle low. For example, if you believe that $34 is the likely low point for FCX's current downtrend, you might consider putting on some shares near $36, a larger percentage near $35.25, and an even larger number near $34, perhaps using $32 as your stop-loss on the entire position. If you had an average buy price of about $34.75 and were then expecting FCX to rise to say, $40, your risk/reward ratio for the entire position would look something like this: Average cost: 34.75 Stop-loss: 32.00 Risk per share: 2.75 Target: $40.00 Potential profit per share: 5.25 Risk/reward ratio: 5.25/2.75 or 1.91 to 1 This is not a specific recommendation, but rather an example of how you might want to consider using cyclical analysis with a very simple form of scale trading in a stock known to make powerful swing moves in either direction. FCX also pays a nice 2.7% dividend, which is icing on the cake if you can learn to accurately identify this metals powerhouse stock's cyclical low points on a regular basis. |
Donald W. Pendergast is a financial markets consultant who offers specialized services to stock brokers and high net worth individuals who seek a better bottom line for their portfolios.
| Title: | Writer, market consultant |
| Company: | Linear Trading Systems LLC |
| Jacksonville, FL 32217 | |
| Phone # for sales: | 904-239-9564 |
| E-mail address: | lineartradingsys@gmail.com |
Traders' Resource Links | |
| Linear Trading Systems LLC has not added any product or service information to TRADERS' RESOURCE. | |
Click here for more information about our publications!
PRINT THIS ARTICLE

Request Information From Our Sponsors
- StockCharts.com, Inc.
- Candle Patterns
- Candlestick Charting Explained
- Intermarket Technical Analysis
- John Murphy on Chart Analysis
- John Murphy's Chart Pattern Recognition
- John Murphy's Market Message
- MurphyExplainsMarketAnalysis-Intermarket Analysis
- MurphyExplainsMarketAnalysis-Visual Analysis
- StockCharts.com
- Technical Analysis of the Financial Markets
- The Visual Investor
- VectorVest, Inc.
- Executive Premier Workshop
- One-Day Options Course
- OptionsPro
- Retirement Income Workshop
- Sure-Fire Trading Systems (VectorVest, Inc.)
- Trading as a Business Workshop
- VectorVest 7 EOD
- VectorVest 7 RealTime/IntraDay
- VectorVest AutoTester
- VectorVest Educational Services
- VectorVest OnLine
- VectorVest Options Analyzer
- VectorVest ProGraphics v6.0
- VectorVest ProTrader 7
- VectorVest RealTime Derby Tool
- VectorVest Simulator
- VectorVest Variator
- VectorVest Watchdog
