HOT TOPICS LIST
- MACD
- Fibonacci
- RSI
- Gann
- ADXR
- Stochastics
- Volume
- Triangles
- Futures
- Cycles
- Volatility
- ZIGZAG
- MESA
- Retracement
- Aroon
INDICATORS LIST
LIST OF TOPICS
PRINT THIS ARTICLE
by Donald W. Pendergast, Jr.
With a drop below $76.60 set to resume the downtrend in shares of National Oilwell Varco, price cycle analysis suggests that a run toward $73.00 may be a high-probability event.
Position: N/A
Donald W. Pendergast, Jr.
Donald W. Pendergast is a financial markets consultant who offers specialized services to stock brokers and high net worth individuals who seek a better bottom line for their portfolios.
PRINT THIS ARTICLE
CYCLES
National Oilwell Varco Consolidating Before A Drop?
03/30/12 09:07:40 AMby Donald W. Pendergast, Jr.
With a drop below $76.60 set to resume the downtrend in shares of National Oilwell Varco, price cycle analysis suggests that a run toward $73.00 may be a high-probability event.
Position: N/A
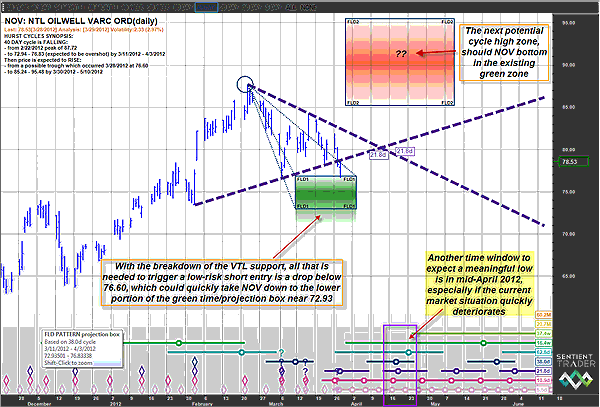
| Shares of National Oilwell Varco (NOV) rose by nearly 83% between early October 2011 and late February 2012, no doubt bringing many smiles to existing shareholders who may have been scarred by last summer's horrifying plunge of 44.68% in only 10 weeks. NOV is a stock that can definitely trend hard in either direction, making it a potential favorite among serious energy sector swing traders and investors. The short-term short setup we want to examine today, however, is focused on taking advantage of a potential break below strong support in the stock at $76.60 and then riding it down toward the lower edge of the current cycle low time/price projection area identified on NOV's daily chart (Figure 1). The upwardly slanted VTL (valid trendline) has already been breached by NOV on a closing basis, thus confirming that the 38-day cycle high of February 22, 2012, is indeed confirmed and all that may be needed to initiate enough selling to bring price down to the previously mentioned time/price projection area (that runs until April 3, 2012, and with a low price target of $72.93) is a break below the $76.60 support formed by the swing lows of March 6 and March 28, respectively. |

|
| FIGURE 1: NOV, DAILY. A break below 76.60 could easily lead to a drop into the lower portion of the green time/price projection zone by early April 2012. |
| Graphic provided by: Sentient Trader. |
| |
| Playing NOV here on the short side is fairly straightforward: place a sell-stop (market or limit, your choice) at about $76.58 and then place a buy to cover order (GTC) just above Wednesday's high of $78.68 as your stop-loss. Assuming a target of the lower part of the green box at $72.93, the risk/reward ratio of such a setup comes in at about 1.74 to 1, which is pretty good for such a short-term potential short setup. The 21-day Chaikin money flow (CMF)(21) has begun to drop off sharply in recent days, perhaps also another tipoff that the smart money is distributing some stock ahead of an anticipated drop into support. Longer-term money flows are still positive, however, suggesting that traders need to keep a sharp eye on any new short positions, running a fairly close profit target and fully prepared to close out the position if either the profit target (near $73.00) or the stop-loss is hit, no questions asked. |

|
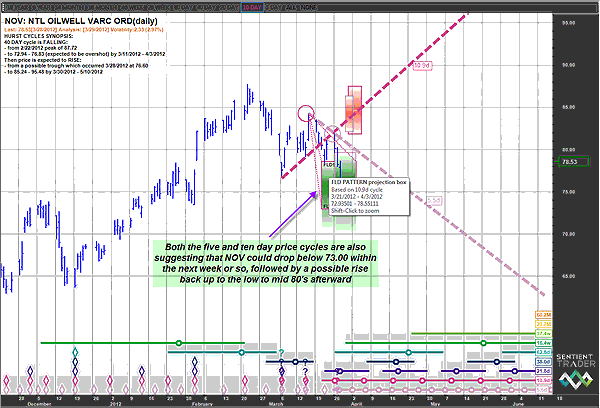
| FIGURE 2: NOV, DAILY. The shorter five- and 10-day price cycles are also in agreement that a trip down to the 73.00 area might be due by early April 2012. |
| Graphic provided by: Sentient Trader. |
| |
| The broad market direction directly affects the price actions of the majority of stocks, and NOV is no exception. With the recent gyrations on the .SPX over the past three weeks (very typical of the volatility seen at major market tops) looking more and more like the beginnings of a major trend reversal, going short NOV on a break below $76.60 looks like a fairly safe (and reasonably sane) short trade recipe. Just remember to use a trailing stop (a two-bar trail of the daily highs is about as good as any other kind of trail on a short-term trade like this with a clearly defined profit target) and close out the position if you get close to the target of $72.93. (See Figure 2.) In other words, if the market grants you a swift plunge in NOV to $73.35 or something, don't be an idiot -- take most of the money and run, maybe leaving a little of the position on just in case it really does want to travel bit farther south. As always, risk no more than 1% to 2% of your account value and try to stay away from the use of margin unless you are an extremely successful short-seller. |
Donald W. Pendergast is a financial markets consultant who offers specialized services to stock brokers and high net worth individuals who seek a better bottom line for their portfolios.
| Title: | Writer, market consultant |
| Company: | Linear Trading Systems LLC |
| Jacksonville, FL 32217 | |
| Phone # for sales: | 904-239-9564 |
| E-mail address: | lineartradingsys@gmail.com |
Traders' Resource Links | |
| Linear Trading Systems LLC has not added any product or service information to TRADERS' RESOURCE. | |
Click here for more information about our publications!
PRINT THIS ARTICLE

Request Information From Our Sponsors
- StockCharts.com, Inc.
- Candle Patterns
- Candlestick Charting Explained
- Intermarket Technical Analysis
- John Murphy on Chart Analysis
- John Murphy's Chart Pattern Recognition
- John Murphy's Market Message
- MurphyExplainsMarketAnalysis-Intermarket Analysis
- MurphyExplainsMarketAnalysis-Visual Analysis
- StockCharts.com
- Technical Analysis of the Financial Markets
- The Visual Investor
- VectorVest, Inc.
- Executive Premier Workshop
- One-Day Options Course
- OptionsPro
- Retirement Income Workshop
- Sure-Fire Trading Systems (VectorVest, Inc.)
- Trading as a Business Workshop
- VectorVest 7 EOD
- VectorVest 7 RealTime/IntraDay
- VectorVest AutoTester
- VectorVest Educational Services
- VectorVest OnLine
- VectorVest Options Analyzer
- VectorVest ProGraphics v6.0
- VectorVest ProTrader 7
- VectorVest RealTime Derby Tool
- VectorVest Simulator
- VectorVest Variator
- VectorVest Watchdog
