HOT TOPICS LIST
- MACD
- Fibonacci
- RSI
- Gann
- ADXR
- Stochastics
- Volume
- Triangles
- Futures
- Cycles
- Volatility
- ZIGZAG
- MESA
- Retracement
- Aroon
INDICATORS LIST
LIST OF TOPICS
PRINT THIS ARTICLE
by Chaitali Mohile
Will Eldorado Gold Corp. sustain support?
Position: N/A
Chaitali Mohile
Active trader in the Indian stock markets since 2003 and a full-time writer. Trading is largely based upon technical analysis.
PRINT THIS ARTICLE
SUPPORT & RESISTANCE
EGO At Support
04/02/12 12:50:48 PMby Chaitali Mohile
Will Eldorado Gold Corp. sustain support?
Position: N/A
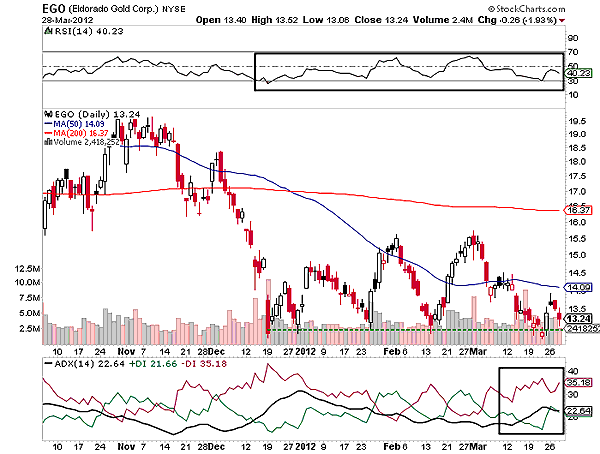
| Eldorado Gold Corp. (EGO) is consolidating at the bottom of a short-term bearish rally. Although the loss incurred by the rally is not huge, it has reversed a weak trend into an intermediate downtrend. The stock has plunged from 19.5 to 13 levels in a short period. Meantime, the 50-day and the 200-day moving averages (MA) underwent a bearish crossover, inducing additional bearish pressure in EGO. Both the moving averages diverted after the crossover. The stock established support at $13 in Figure 1. Thereafter, EGO consolidated with a stable lower range and shaky upper range. The descending 50-day MA discouraged all the efforts to pull back. The price moved within the support-resistance zone of the short-term moving average. |

|
| FIGURE 1: EGO, DAILY |
| Graphic provided by: StockCharts.com. |
| |
| EGO has been moving sideways since mid December 2011. The relative strength index (RSI) (14) ranged between 70 and 30 levels, indicating instability in the stock. The price rally lacked bullish as well bearish strength, and therefore, the stock is shaky in both the directions. This movement also reflects high volatility. The average directional index (ADX) (14) is unable to surge above 20 levels, the selling and buying pressure indicated by the negative directional index (-DI), and positive directional index(+DI) respectively are tangled. Thus, the ADX (14) is suggesting a weak trend. |
| In such a scenario, EGO is likely to breach its support at $13. In addition, the 50-day MA resistance has moved closer to the price rally. Currently, the ADX (14) is indicating a developing downtrend. |

|
| FIGURE 2: EGO, MONTHLY |
| Graphic provided by: StockCharts.com. |
| |
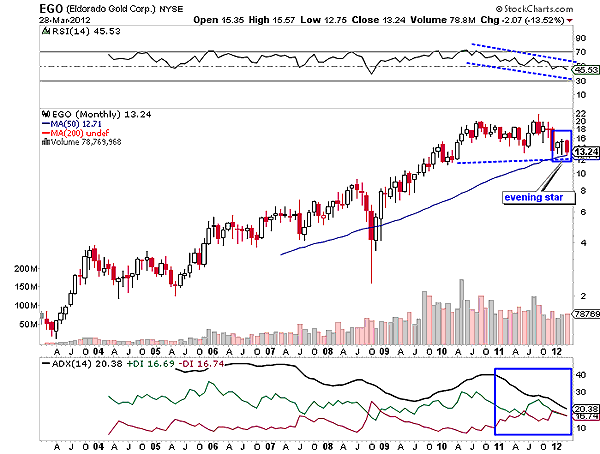
| According to the monthly time frame chart in Figure 2, a long and steady bullish rally of EGO consolidated wherever necessary. The sideways rally formed the support-resistance for the future rally. In 2010, EGO moved horizontally, forming support at $12. The stock resumed the existing advance rally and formed a top at 22 levels. An uptrend indicated by the ADX (14) was overheated and the RSI (14) showed a negative divergence. Hence, the indicators confirmed the top formation, and a possibility of reversal rally. Thereafter, the price began retracing toward the previous low support at $12. It also has strong support of the 50-day MA. |
| Currently, EGO has hit the support line. However, an evening star candlestick pattern is highlighting the bearish reversal signals. Due to the candlestick pattern, the price is likely to breach support. Considering the ADX line, +DI and -DI positions, it is difficult to understand the current trend. However, the weakening RSI (14) and the evening star candlestick pattern would develop a fresh downtrend for EGO. Thus, EGO would break downward. |
Active trader in the Indian stock markets since 2003 and a full-time writer. Trading is largely based upon technical analysis.
| Company: | Independent |
| Address: | C1/3 Parth Indraprasth Towers. Vastrapur |
| Ahmedabad, Guj 380015 | |
| E-mail address: | chaitalimohile@yahoo.co.in |
Traders' Resource Links | |
| Independent has not added any product or service information to TRADERS' RESOURCE. | |
Click here for more information about our publications!
PRINT THIS ARTICLE

Request Information From Our Sponsors
- StockCharts.com, Inc.
- Candle Patterns
- Candlestick Charting Explained
- Intermarket Technical Analysis
- John Murphy on Chart Analysis
- John Murphy's Chart Pattern Recognition
- John Murphy's Market Message
- MurphyExplainsMarketAnalysis-Intermarket Analysis
- MurphyExplainsMarketAnalysis-Visual Analysis
- StockCharts.com
- Technical Analysis of the Financial Markets
- The Visual Investor
- VectorVest, Inc.
- Executive Premier Workshop
- One-Day Options Course
- OptionsPro
- Retirement Income Workshop
- Sure-Fire Trading Systems (VectorVest, Inc.)
- Trading as a Business Workshop
- VectorVest 7 EOD
- VectorVest 7 RealTime/IntraDay
- VectorVest AutoTester
- VectorVest Educational Services
- VectorVest OnLine
- VectorVest Options Analyzer
- VectorVest ProGraphics v6.0
- VectorVest ProTrader 7
- VectorVest RealTime Derby Tool
- VectorVest Simulator
- VectorVest Variator
- VectorVest Watchdog
