HOT TOPICS LIST
- MACD
- Fibonacci
- RSI
- Gann
- ADXR
- Stochastics
- Volume
- Triangles
- Futures
- Cycles
- Volatility
- ZIGZAG
- MESA
- Retracement
- Aroon
INDICATORS LIST
LIST OF TOPICS
PRINT THIS ARTICLE
by Donald W. Pendergast, Jr.
Shares of Terex Corp. may be preparing to make a major retest of support near the $22 price zone.
Position: N/A
Donald W. Pendergast, Jr.
Donald W. Pendergast is a financial markets consultant who offers specialized services to stock brokers and high net worth individuals who seek a better bottom line for their portfolios.
PRINT THIS ARTICLE
For Terex Corp., Major Support Test Looms Large
03/30/12 08:24:57 AMby Donald W. Pendergast, Jr.
Shares of Terex Corp. may be preparing to make a major retest of support near the $22 price zone.
Position: N/A
| After enjoying substantial gains since making a major low last October, shares of Terex Corp. (TEX) appear to be considering a move down to retest a major support level, one that may very well help determine what the next series of tradable moves are in this heavy construction machinery manufacturer's stock. Here's a closer look now. |

|
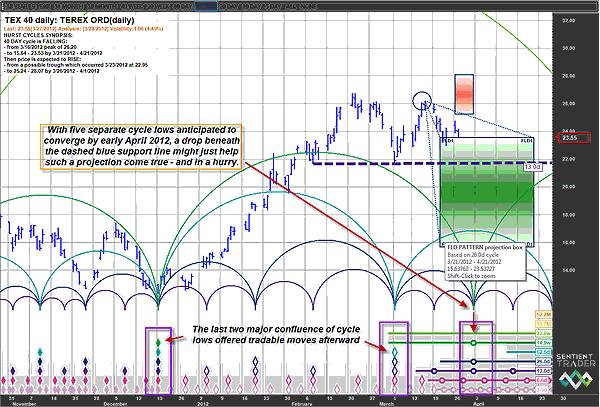
| FIGURE 1: TEX, DAILY. Early April 2012 looks to be a possible point of convergence for at least five separate price cycles in shares of Terex Corp. |
| Graphic provided by: Sentient Trader. |
| |
| At certain times, performing cyclical analysis is relatively easy; this may be one of those times, at least as far as making sense out of TEX's next likely move. First off, let's look at the major support level for what Sentient Trader's Hurst algorithms have identified as the primary support level for the 26-day cycle lows, as depicted by the 13-day VTL (valid trendline), the dashed blue line that connects the last two cycle lows of the 26-day cycle. See Figure 1. A break in price below this level may provide added incentive for the bears to claw prices down into the lower portion of the green time/price projection box, which is now advising that TEX may fall as low as $15.64 by April 21, 2012, before a meaningful low is achieved. Note that as many as five separate cycles are all in apparent agreement that sometime around early April 2012, a significant low should be due in this stock. Again, that support level line needs to be taken out soon in order for this to happen, preferably aided by a continued selloff in the broad market indexes. The last two major cycle low confluences (purple boxes at bottom of chart) called for significant, tradable swing lows in TEX, so it will be interesting to see if the same kind of opportunity will once again be availed to bulls in this fairly volatile mid-cap issue. See Figure 2. Short-term money flow, based on the 34-period Chaikin money flow histogram (CMF)(34), is also deteriorating at a rapid rate, possibly yet another warning that TEX will soon make a move down to support near $21.65. |

|
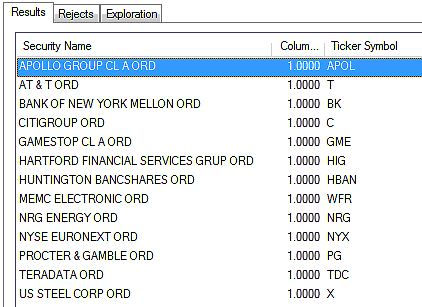
| FIGURE 2: LARGE-CAP STOCKS. Here are large-cap stocks that are firing new short RMO swing sell signals. Many of these stocks also feature declining near-term price cycles. |
| Graphic provided by: MetaStock. |
| Graphic provided by: MetaStock Explorer. |
| |
| The broad markets are also looking more and more vulnerable to a further round of correction, and with the area of 1370.00 on the .SPX offering the first near-term support level, TEX should have little trouble making it down to $21.65 within the next week. As far as trading TEX goes, buying slightly in-the-money (ITM) puts with at least two to three months of time value might be one rational way to play an anticipated move down to support; you could always close out half the position for a profit near $21.65 and then run a trailing stop on the balance of the position in case TEX decides to decline further down into the green time/price projection zone. It's really your call, but at least you know that several cycles are all in declining mode in this stock, allowing you a bit of extra confidence if you decide to try and game a move lower by selling short or buying puts. |
Donald W. Pendergast is a financial markets consultant who offers specialized services to stock brokers and high net worth individuals who seek a better bottom line for their portfolios.
| Title: | Writer, market consultant |
| Company: | Linear Trading Systems LLC |
| Jacksonville, FL 32217 | |
| Phone # for sales: | 904-239-9564 |
| E-mail address: | lineartradingsys@gmail.com |
Traders' Resource Links | |
| Linear Trading Systems LLC has not added any product or service information to TRADERS' RESOURCE. | |
Click here for more information about our publications!
PRINT THIS ARTICLE

Request Information From Our Sponsors
- StockCharts.com, Inc.
- Candle Patterns
- Candlestick Charting Explained
- Intermarket Technical Analysis
- John Murphy on Chart Analysis
- John Murphy's Chart Pattern Recognition
- John Murphy's Market Message
- MurphyExplainsMarketAnalysis-Intermarket Analysis
- MurphyExplainsMarketAnalysis-Visual Analysis
- StockCharts.com
- Technical Analysis of the Financial Markets
- The Visual Investor
- VectorVest, Inc.
- Executive Premier Workshop
- One-Day Options Course
- OptionsPro
- Retirement Income Workshop
- Sure-Fire Trading Systems (VectorVest, Inc.)
- Trading as a Business Workshop
- VectorVest 7 EOD
- VectorVest 7 RealTime/IntraDay
- VectorVest AutoTester
- VectorVest Educational Services
- VectorVest OnLine
- VectorVest Options Analyzer
- VectorVest ProGraphics v6.0
- VectorVest ProTrader 7
- VectorVest RealTime Derby Tool
- VectorVest Simulator
- VectorVest Variator
- VectorVest Watchdog
