HOT TOPICS LIST
- MACD
- Fibonacci
- RSI
- Gann
- ADXR
- Stochastics
- Volume
- Triangles
- Futures
- Cycles
- Volatility
- ZIGZAG
- MESA
- Retracement
- Aroon
INDICATORS LIST
LIST OF TOPICS
PRINT THIS ARTICLE
by Donald W. Pendergast, Jr.
Cyclical analysis suggests that shares of Stillwater Mining may soon fall, reaching a tradable low in the near future.
Position: N/A
Donald W. Pendergast, Jr.
Donald W. Pendergast is a financial markets consultant who offers specialized services to stock brokers and high net worth individuals who seek a better bottom line for their portfolios.
PRINT THIS ARTICLE
CYCLES
For Stillwater Mining, A Drop, Then A Pop?
03/29/12 09:05:18 AMby Donald W. Pendergast, Jr.
Cyclical analysis suggests that shares of Stillwater Mining may soon fall, reaching a tradable low in the near future.
Position: N/A
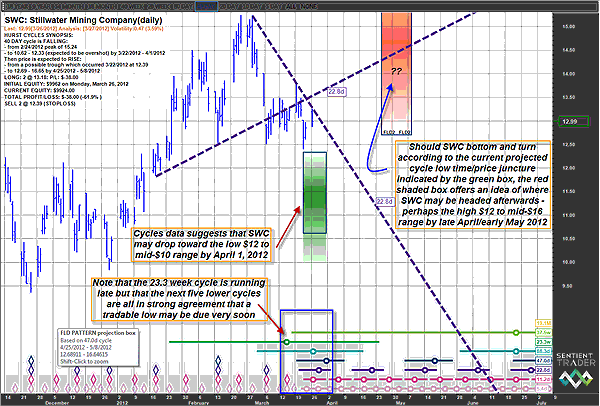
| Like just about every other stock out there, Stillwater Mining (SWC) enjoyed a very nice gain coming out of the major low made on October 4, 2011. Share prices increased by nearly 110%, finally peaking on February 24, 2012, at $15.24. Obviously, if you like trading high-beta stocks (that is, volatile compared to the broad market averages), then SWC might just be the perfect cup of tea. However, having made such a stupendous runup in such a short period of time, the stock may also be vulnerable to further declines, and with the initial descent from that February peak now seeing SWC in a sideways trading range, enterprising swing traders need to start sizing up the possibilities that the stock may yet have some more downside in store. It might seem silly to be looking for shorting opportunities now, what with the .SPX, .NDX, and .RUT all surging again. But with even these three key stock indexes looking as if they need a good 6% to 8% correction before being able to go even higher (it could happen), the more potential short setups you can identify now, the easier your job will be when it comes time to cash in on the next unexpected drop in the US markets. There are several items of note to traders on this daily chart: 1. SWC remains below the 22.8-day VTL (the upwardly slanted valid trendline), which confirms that February 24, 2012, was indeed the high of the 47-day price cycle. 2. SWC also remains below its other 22.8-day VTL, one which, when violated to the upside, confirms the next 47-day cycle low. Until this line is broken with a daily close above it, the price trend must still be assumed to be down. 3. The best cycle projections appear to agree that SWC may be on track to make a meaningful cycle low by early April 2012 (within the next week or so) somewhere between the mid-$10 to low-$12 price range. Of special interest is the fact that the 23.3-week cycle is already overdue, but the 88-, 47-, 23-, 11-, and five-day cycles are all in close agreement that early April should see some sort of a move to a meaningful cycle low. It's also worthy to note that SWC may be in a pause phase before embarking on a continuation move lower out of its current trading range. Adding a little more fuel to the argument for a near-term decline is the fact that SWC's long-term money flow (CMF)(100) is in bearish territory. Finally, any sudden selloff in the major stock indexes is also likely to hasten the anticipated outcome of the price projections offered by Figure 1. |

|
| FIGURE 1: SWC, DAILY. A break below $12.39 could be the catalyst that gets SWC sellers motivated to bring the stock down to its next confluence of cyclical lows. |
| Graphic provided by: Sentient Trader. |
| |
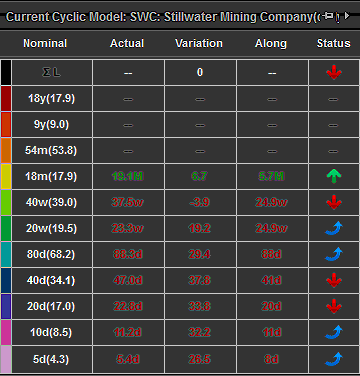
| The bottom line here is that SWC looks likely to drop a bit further over the next week or so (perhaps two weeks), offering nimble short-sellers a chance to capitalize on a swift run down toward the next confluence of cycle lows (Figure 2). Less adventurous traders and investors will probably want to simply wait for the next low to form and the downsloping VTL to be taken out before beginning to add new long positions, which may ultimately go to the time/price juncture depicted by the red box on the chart. For traders who love volatile, projectile-like stocks, SWC is the real deal. Just make sure you always limit your risk and don't get married to any position for too long -- learn to cut your losses quickly and wait for a better setup to come along. |

|
| FIGURE 2: PRICE CYCLES. Here's a table view of the current direction of the various price cycles driving the action in SWC, one of the most volatile metals mining stocks of all. |
| Graphic provided by: Sentient Trader. |
| |
Donald W. Pendergast is a financial markets consultant who offers specialized services to stock brokers and high net worth individuals who seek a better bottom line for their portfolios.
| Title: | Writer, market consultant |
| Company: | Linear Trading Systems LLC |
| Jacksonville, FL 32217 | |
| Phone # for sales: | 904-239-9564 |
| E-mail address: | lineartradingsys@gmail.com |
Traders' Resource Links | |
| Linear Trading Systems LLC has not added any product or service information to TRADERS' RESOURCE. | |
Click here for more information about our publications!
PRINT THIS ARTICLE

Request Information From Our Sponsors
- StockCharts.com, Inc.
- Candle Patterns
- Candlestick Charting Explained
- Intermarket Technical Analysis
- John Murphy on Chart Analysis
- John Murphy's Chart Pattern Recognition
- John Murphy's Market Message
- MurphyExplainsMarketAnalysis-Intermarket Analysis
- MurphyExplainsMarketAnalysis-Visual Analysis
- StockCharts.com
- Technical Analysis of the Financial Markets
- The Visual Investor
- VectorVest, Inc.
- Executive Premier Workshop
- One-Day Options Course
- OptionsPro
- Retirement Income Workshop
- Sure-Fire Trading Systems (VectorVest, Inc.)
- Trading as a Business Workshop
- VectorVest 7 EOD
- VectorVest 7 RealTime/IntraDay
- VectorVest AutoTester
- VectorVest Educational Services
- VectorVest OnLine
- VectorVest Options Analyzer
- VectorVest ProGraphics v6.0
- VectorVest ProTrader 7
- VectorVest RealTime Derby Tool
- VectorVest Simulator
- VectorVest Variator
- VectorVest Watchdog
