HOT TOPICS LIST
- MACD
- Fibonacci
- RSI
- Gann
- ADXR
- Stochastics
- Volume
- Triangles
- Futures
- Cycles
- Volatility
- ZIGZAG
- MESA
- Retracement
- Aroon
INDICATORS LIST
LIST OF TOPICS
PRINT THIS ARTICLE
by Mike Carr, CMT
There is a well-documented cycle in markets related to Presidential elections. This pattern suggests stock and bond market weakness in the short term.
Position: Buy
Mike Carr, CMT
Mike Carr, CMT, is a member of the Market Technicians Association, and editor of the MTA's newsletter, Technically Speaking. He is also the author of "Smarter Investing in Any Economy: The Definitive Guide to Relative Strength Investing," and "Conquering the Divide: How to Use Economic Indicators to Catch Stock Market Trends."
PRINT THIS ARTICLE
CYCLES
Election Cycle Bearish For Stocks And Bonds In The Short Term
03/27/12 01:15:03 PMby Mike Carr, CMT
There is a well-documented cycle in markets related to Presidential elections. This pattern suggests stock and bond market weakness in the short term.
Position: Buy
| Politicians spend a great deal of time and effort seeking election. This effort has led many to believe that a clear pattern of behavior has evolved where politicians try to set policy goals in line with the election cycle. Presidential elections occur every four years, and this logic would point to a four-year cycle in the markets. Immediately after the election, the new President does his best to implement policies without thinking about how the policy will affect reelection since the next election is so far off. This is when unpopular polices would be passed and any short-term pain (like higher taxes or new regulations that come with high costs) should be implemented, according to the theory. On average, the first year of a President's term is associated with the poorest stock market performance of the four-year cycle. The second year, when midterm elections are held in Congress, shows some improvement. By the third year, according to this theory, the President should be implementing the policies that will help the economy in the next election year. The third year is the best of the four on average. Election years are generally up years. |
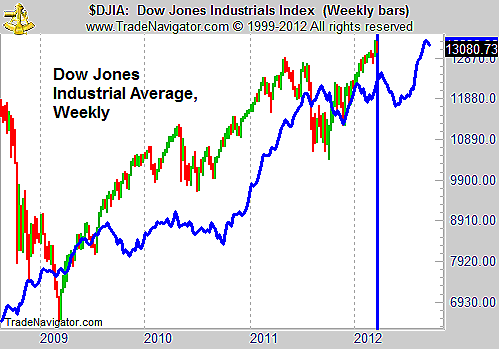
| This pattern can be seen in the market. The average performance has been added as a projection to the weekly chart of the Dow Jones Industrial Average (DJIA) in Figure 1. On average, stocks peak in April, fall in the spring, and then recover slowly until July, when they turn sharply higher. If that pattern repeats this year, a selloff in stocks could occur soon. |

|
| FIGURE 1: DJIA, WEEKLY. The DJIA has been following the general election cycle fairly closely in the past few years. |
| Graphic provided by: Trade Navigator. |
| |
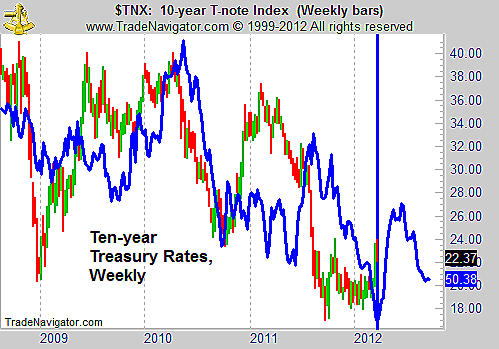
| If this pattern is found in stocks, it should also be visible in other markets that react to government policy decisions. Bonds are directly affected by policy and the deficit is likely to be a topic of debate in the upcoming election season, which means we could see interest rates move sharply. The historical pattern suggests that rates on the 10-year Treasury note should move higher into June before falling as the election draws closer (Figure 2). The price of bonds and interest rates move in opposite directions (as interest rates rise, the price of bonds should fall) so the Presidential cycle is bearish on bonds for the short term. |

|
| FIGURE 2: 10-YEAR T-NOTE, WEEKLY. Interest rates could rise if they follow the four-year cycle in the next few months. |
| Graphic provided by: Trade Navigator. |
| |
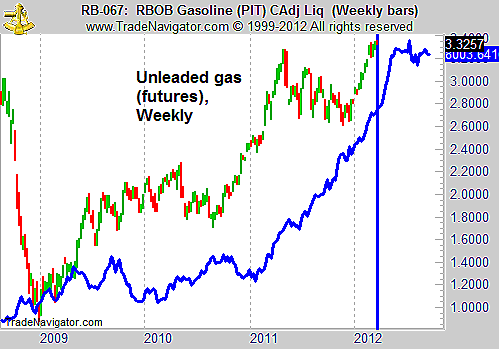
| Many market watchers and political commentators are watching the retail price of gasoline for clues on how the election will go. The Presidential cycle shows that the trend in unleaded gasoline futures is higher into July (Figure 3). Prices at the pump tend to move in the same general direction as futures prices, and the Energy Information Administration has noted that gasoline pump prices average about $0.70 more a gallon than spot futures prices. This is an average, and the market price can move significantly above or below that average, but the current price of futures does point toward gas reaching about $4 a gallon soon. |

|
| FIGURE 3: UNLEADED GAS, WEEKLY. Higher gas prices could disrupt the summer plans of many families if gasoline follows the four-year cycle. |
| Graphic provided by: Trade Navigator. |
| |
| There is a sound logic that supports the existence of a four-year cycle in prices tied to the Presidential election. If the price action unfolds according to that pattern this year, traders can benefit from this cycle by shorting stocks, shorting bonds, and going long gasoline futures. |
Mike Carr, CMT, is a member of the Market Technicians Association, and editor of the MTA's newsletter, Technically Speaking. He is also the author of "Smarter Investing in Any Economy: The Definitive Guide to Relative Strength Investing," and "Conquering the Divide: How to Use Economic Indicators to Catch Stock Market Trends."
| Website: | www.moneynews.com/blogs/MichaelCarr/id-73 |
| E-mail address: | marketstrategist@gmail.com |
Click here for more information about our publications!
PRINT THIS ARTICLE

Request Information From Our Sponsors
- VectorVest, Inc.
- Executive Premier Workshop
- One-Day Options Course
- OptionsPro
- Retirement Income Workshop
- Sure-Fire Trading Systems (VectorVest, Inc.)
- Trading as a Business Workshop
- VectorVest 7 EOD
- VectorVest 7 RealTime/IntraDay
- VectorVest AutoTester
- VectorVest Educational Services
- VectorVest OnLine
- VectorVest Options Analyzer
- VectorVest ProGraphics v6.0
- VectorVest ProTrader 7
- VectorVest RealTime Derby Tool
- VectorVest Simulator
- VectorVest Variator
- VectorVest Watchdog
- StockCharts.com, Inc.
- Candle Patterns
- Candlestick Charting Explained
- Intermarket Technical Analysis
- John Murphy on Chart Analysis
- John Murphy's Chart Pattern Recognition
- John Murphy's Market Message
- MurphyExplainsMarketAnalysis-Intermarket Analysis
- MurphyExplainsMarketAnalysis-Visual Analysis
- StockCharts.com
- Technical Analysis of the Financial Markets
- The Visual Investor
