HOT TOPICS LIST
- MACD
- Fibonacci
- RSI
- Gann
- ADXR
- Stochastics
- Volume
- Triangles
- Futures
- Cycles
- Volatility
- ZIGZAG
- MESA
- Retracement
- Aroon
INDICATORS LIST
LIST OF TOPICS
PRINT THIS ARTICLE
by Donald W. Pendergast, Jr.
When a stock or industry group fails to participate in a market-wide rally, technicians and fundamental analysts want to know why.
Position: N/A
Donald W. Pendergast, Jr.
Donald W. Pendergast is a financial markets consultant who offers specialized services to stock brokers and high net worth individuals who seek a better bottom line for their portfolios.
PRINT THIS ARTICLE
TRADING SYSTEMS
TIE's New RMO Sell Setup
03/27/12 10:25:14 AMby Donald W. Pendergast, Jr.
When a stock or industry group fails to participate in a market-wide rally, technicians and fundamental analysts want to know why.
Position: N/A
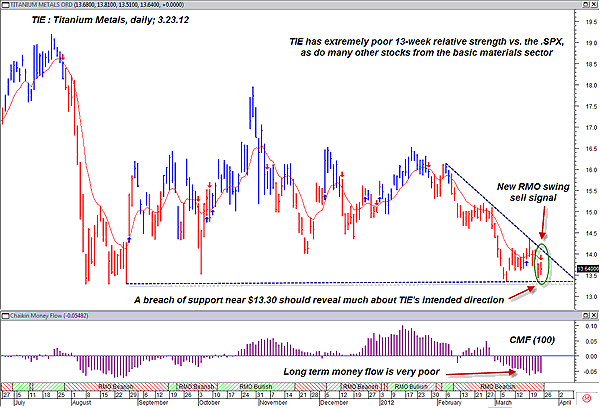
| Shares of Titanium Metals (TIE) not only failed to participate in the market-wide rally that began in late December 2011 -- it's actually just a few pennies higher now than at the major market low of October 4, 2011 -- and is in fact in danger of dropping even further. Here's a closer look now (Figure 1). |

|
| FIGURE 1: TIE, DAILY. Although TIE has very poor long-term money flow, its 40-day price cycle is due for an upturn. Expect to see some powerful price moves (in either direction) if the powerful support level near $13.30 is tested again. |
| Graphic provided by: MetaStock. |
| Graphic provided by: RMO from MetaStock 11. |
| |
| TIE ran strongly higher along with the rest of the broad market after making a major low on October 4, 2011, but then it gradually began to decouple, failing to join in the astounding series of rallies that commenced in late December 2011. In fact, TIE closed at $13.64 on March 23, 2012, only 12 cents per share higher than its intraday low on October 4, 2011. Clearly, TIE has not been a very good relative strength or bullish momentum play since then, and now that the stock has issued a new RMO (Rahul Mohindar) swing sell signal, the stock may soon face an important test of support. Since early August 2011, TIE has tested the $13.30 area on four separate occasions, and if this new swing sell triggers a short entry on a drop below $13.51, the odds are good that the stock will move quickly to make another test of $13.30. If the stock can manage to bounce higher, taking out the March 2012 swing high of $14.36, the support test will have been deemed a success and the bulls might decide to get much more aggressive in piling back into this high-beta issue again. Conversely, if $13.30 is violated quickly in the midst of a wide-range, high-volume thrust lower, then the bears will still be in control, looking for substantially lower prices. Money flow is very ugly right now (both short term and long term), with the 100-period Chaikin money flow histogram (CMF)(100) revealing the extent of the selling pressure in TIE. This would seem to help bolster the bearish case for this stock, but then again, the 40-day price cycle in the stock is currently projecting a rise over the near term! Suffice it to say that it's going to take a meaningful move below $13.30 or a nice bounce higher to help resolve all of the conflicting technical evidence displayed on this chart. A breakdown by the broad market (most likely due within the next week or two) would also bode well for sellers of TIE, particularly on a drop through the major support discussed. |

|
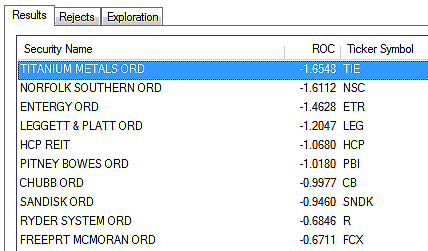
| FIGURE 2: RELATIVE STRENGTH. The weakest relative strength (vs. the .SPX over the last 13 weeks) large-cap stocks firing RMO swing sell signals for March 23, 2012. |
| Graphic provided by: MetaStock. |
| Graphic provided by: MetaStock Explorer. |
| |
| Playing TIE here might be especially well suited to intraday swing traders -- those relying on 30- to 60-minute price charts -- that are ready to ride a break below $13.51 down to $13.30 or so, looking to capitalize on the narrow price window that exists between the new RMO trade trigger price and major support. See Figure 2. If you do take such a trade (remember, it needs to drop below $13.51 to trigger), use a tight stop and be prepared to monitor the stock in real time, as that support level is likely going to act like a magnet, drawing TIE down to make that next test. Overall, this looks to be the only sane, low-risk way to trade TIE on this particular short setup. Be sure to risk no more than 1% to 2% of your account size if you take this trade and try to watch it nonstop until you hit the support target or you get stopped out. |
Donald W. Pendergast is a financial markets consultant who offers specialized services to stock brokers and high net worth individuals who seek a better bottom line for their portfolios.
| Title: | Writer, market consultant |
| Company: | Linear Trading Systems LLC |
| Jacksonville, FL 32217 | |
| Phone # for sales: | 904-239-9564 |
| E-mail address: | lineartradingsys@gmail.com |
Traders' Resource Links | |
| Linear Trading Systems LLC has not added any product or service information to TRADERS' RESOURCE. | |
Click here for more information about our publications!
Comments

Request Information From Our Sponsors
- StockCharts.com, Inc.
- Candle Patterns
- Candlestick Charting Explained
- Intermarket Technical Analysis
- John Murphy on Chart Analysis
- John Murphy's Chart Pattern Recognition
- John Murphy's Market Message
- MurphyExplainsMarketAnalysis-Intermarket Analysis
- MurphyExplainsMarketAnalysis-Visual Analysis
- StockCharts.com
- Technical Analysis of the Financial Markets
- The Visual Investor
- VectorVest, Inc.
- Executive Premier Workshop
- One-Day Options Course
- OptionsPro
- Retirement Income Workshop
- Sure-Fire Trading Systems (VectorVest, Inc.)
- Trading as a Business Workshop
- VectorVest 7 EOD
- VectorVest 7 RealTime/IntraDay
- VectorVest AutoTester
- VectorVest Educational Services
- VectorVest OnLine
- VectorVest Options Analyzer
- VectorVest ProGraphics v6.0
- VectorVest ProTrader 7
- VectorVest RealTime Derby Tool
- VectorVest Simulator
- VectorVest Variator
- VectorVest Watchdog
