HOT TOPICS LIST
- MACD
- Fibonacci
- RSI
- Gann
- ADXR
- Stochastics
- Volume
- Triangles
- Futures
- Cycles
- Volatility
- ZIGZAG
- MESA
- Retracement
- Aroon
INDICATORS LIST
LIST OF TOPICS
PRINT THIS ARTICLE
by Koos van der Merwe
Is it time to buy gold? My charts are saying, "Not yet."
Position: Sell
Koos van der Merwe
Has been a technical analyst since 1969, and has worked as a futures and options trader with First Financial Futures in Johannesburg, South Africa.
PRINT THIS ARTICLE
ELLIOTT WAVE
To Gold Or Not To Gold
03/27/12 10:16:52 AMby Koos van der Merwe
Is it time to buy gold? My charts are saying, "Not yet."
Position: Sell
| Gold has become a currency play. As the US dollar, which was the currency of the world, weakened as Federal Reserve chairman Ben Bernanke printed US currency as a way to support the banks and get the US economy out of the mess created by the banks, gold rose logarithmically. The fear of inflation was dissipated by inflation conqueror Paul Volcker, who was appointed to do just that -- make sure that inflation remained in check. With low interest rates, dividend-paying stocks became the favored stocks. Now, with the US economy starting to show strong recovery signs, the probability that the US dollar will start strengthening is causing the gold price to fall. What do my charts say? |

|
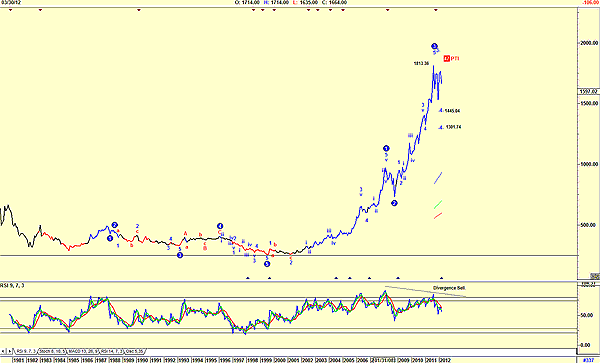
| FIGURE 1: LONDON GOLD WITH ELLIOTT WAVE COUNT |
| Graphic provided by: AdvancedGET. |
| |
| Figure 1 is the monthly chart of London gold. The chart suggests that the gold price has completed a wave 3 up and is now in a wave 4 correction, with targets of 1445.04 or 1301.74. The probability index (PTI) is giving a 47% probability of that occurring. The relative strength index (RSI) has given a divergence sell signal, confirming weakness. |

|
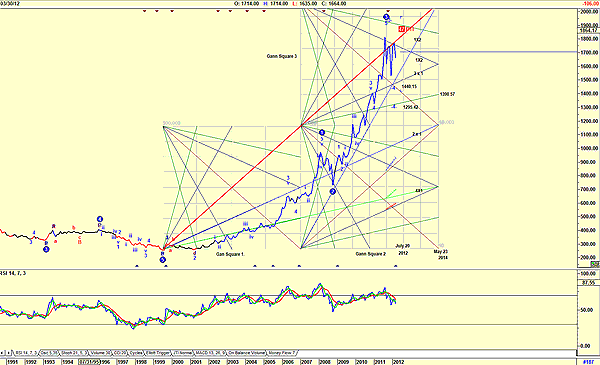
| FIGURE 2: LONDON GOLD GANN CHART |
| Graphic provided by: AdvancedGET. |
| |
| Figure 2 shows the gold price with three Gann squares. We can see how the gold price found resistance on the 1 x 1 angle (in red). It started by following the 4x1 (green) angle, moved to the 2x1 angle, then followed the 1x2 (blue) angle of the second Gann square until it reached the 1x1of the third Gann square. By all accounts, it should now fall to the eighth line at 1390.57, or close to it. This will be within the fourth wave of lesser degree. The two vertical lines of the Gann square at July 20 and May 23 do suggest a possible time sequence, but we cannot accept that as genuine. However, do note the half-square vertical lines, how the high turning points do appear to top out on those dates. This does suggest that a bottom turning point could occur on July 20, 2012, or May 23, 2014. My charts do suggest that the gold price is falling and could possibly find support on the 1390.57 level, at the 4 x 1 line of Gann square 3. This is confirmed by the RSI, which has given a divergence sell signal. Possible dates are July 2012 or May 2013 for a bottom. |
Has been a technical analyst since 1969, and has worked as a futures and options trader with First Financial Futures in Johannesburg, South Africa.
| Address: | 3256 West 24th Ave |
| Vancouver, BC | |
| Phone # for sales: | 6042634214 |
| E-mail address: | petroosp@gmail.com |
Click here for more information about our publications!
PRINT THIS ARTICLE

|

Request Information From Our Sponsors
- StockCharts.com, Inc.
- Candle Patterns
- Candlestick Charting Explained
- Intermarket Technical Analysis
- John Murphy on Chart Analysis
- John Murphy's Chart Pattern Recognition
- John Murphy's Market Message
- MurphyExplainsMarketAnalysis-Intermarket Analysis
- MurphyExplainsMarketAnalysis-Visual Analysis
- StockCharts.com
- Technical Analysis of the Financial Markets
- The Visual Investor
- VectorVest, Inc.
- Executive Premier Workshop
- One-Day Options Course
- OptionsPro
- Retirement Income Workshop
- Sure-Fire Trading Systems (VectorVest, Inc.)
- Trading as a Business Workshop
- VectorVest 7 EOD
- VectorVest 7 RealTime/IntraDay
- VectorVest AutoTester
- VectorVest Educational Services
- VectorVest OnLine
- VectorVest Options Analyzer
- VectorVest ProGraphics v6.0
- VectorVest ProTrader 7
- VectorVest RealTime Derby Tool
- VectorVest Simulator
- VectorVest Variator
- VectorVest Watchdog
