HOT TOPICS LIST
- MACD
- Fibonacci
- RSI
- Gann
- ADXR
- Stochastics
- Volume
- Triangles
- Futures
- Cycles
- Volatility
- ZIGZAG
- MESA
- Retracement
- Aroon
INDICATORS LIST
LIST OF TOPICS
PRINT THIS ARTICLE
by Koos van der Merwe
The bears haven't given up, even as the market is moving to new highs every day. But what lies around the corner?
Position: Buy
Koos van der Merwe
Has been a technical analyst since 1969, and has worked as a futures and options trader with First Financial Futures in Johannesburg, South Africa.
PRINT THIS ARTICLE
ELLIOTT WAVE
So Are We Seeing A Correction Soon?
03/26/12 09:37:49 AMby Koos van der Merwe
The bears haven't given up, even as the market is moving to new highs every day. But what lies around the corner?
Position: Buy
| An Elliott wave count can change with the wind. As I have always said, the Elliott wave is simply a signpost, giving us an idea of where the market is trending. Figures 1, 2, and 3 are weekly charts of the Dow Jones Industrial Average (DJIA), the Standard & Poor's 500, and NASDAQ indexes. All are at the moment suggesting strength, but... |

|
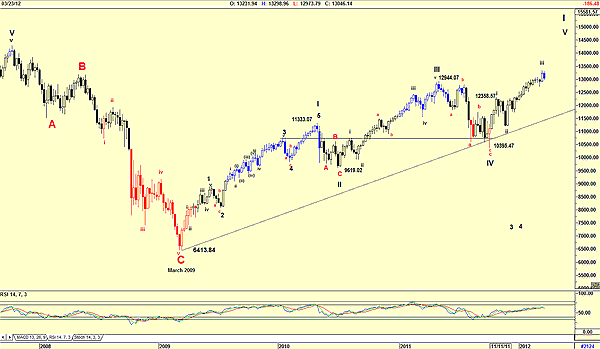
| FIGURE 1: ELLIOTT WAVE COUNT OF THE DJIA, WEEKLY |
| Graphic provided by: AdvancedGET. |
| |
| Figure 1 is a weekly chart of the DJIA, with my current preferred Elliott wave count. The chart suggests that the DJIA bottomed in March 2009, and that it is currently in a wave V of a wave I. The length of wave I is 4919.23 (11333.07 - 6413.84 = 4919.23) and the length of wave III is 3325.05 (12944.07 - 9619.02 = 3325.05). With the length of wave III less than the length of wave I, this means that the length of wave V will be less than the length of wave III. At the moment, the DJIA is in a wave iii of wave V. The future is therefore looking for a wave iv if wave V correction with a major ABC correction (wave II) in the near future. The height of wave V cannot be determined, but we do know that it will be less than 13720.52 (3325.05 + 10395.47 = 13720.52). The DJIA will then correct in wave II for a few months in an ABC correction and will bottom somewhere between 12944.07 and 12358.57. |

|
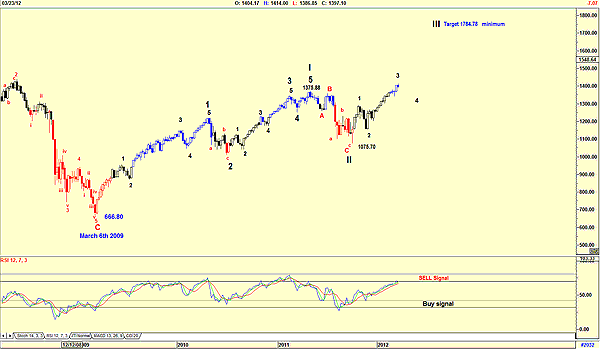
| FIGURE 2: ELLIOTT WAVE COUNT OF THE S&P 500, WEEKLY |
| Graphic provided by: AdvancedGET. |
| |
| The weekly chart of the S&P 500 is a lot more difficult (Figure 2). It is suggesting that the count is in a wave 3 of wave III. Whether this count is correct will be determined as the market evolves. However, whatever the correct count, we do know that the S&P 500 is due for a minor wave 4 of wave III with a major wave IV correction sometime in the future. The relative strength index (RSI) has been very good in determining a major correction, as shown, so we will prefer to keep an eye on that as a forecast for the future. We also know that the wave III top should be 1784.78 (1075.70 + 709.08). The length of wave I is 1375.88 - 666.80 = 709.08. Should the wave II top be less than 1784.78, then we know that wave V will be less than wave III. |

|
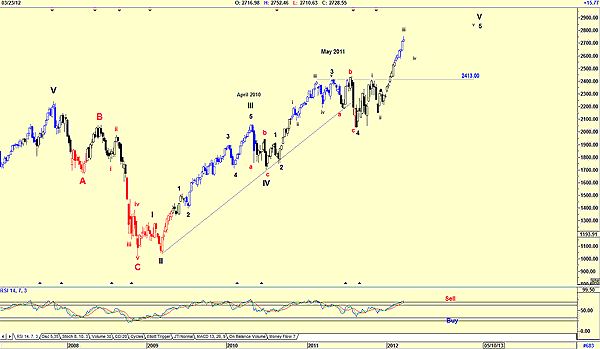
| FIGURE 3: ELLIOTT WAVE COUNT OF THE NASDAQ, WEEKLY |
| Graphic provided by: AdvancedGET. |
| |
| The NASDAQ weekly chart, shown in Figure 3, is perhaps the easiest count of the three, with the chart once again suggesting a correction. This one is a wave 4 of a wave V. With the RSI at overbought levels, we do know that a minor correction is on the cards, to be followed by a wave v of wave 5 of wave V. So yes, a major ABC correction is there, but a long way into the future. To be kind to the bears, yes, the charts do suggest a correction in the near future, but all three charts suggest a minor correction rather than the major one they are calling for. |
Has been a technical analyst since 1969, and has worked as a futures and options trader with First Financial Futures in Johannesburg, South Africa.
| Address: | 3256 West 24th Ave |
| Vancouver, BC | |
| Phone # for sales: | 6042634214 |
| E-mail address: | petroosp@gmail.com |
Click here for more information about our publications!
PRINT THIS ARTICLE

Request Information From Our Sponsors
- StockCharts.com, Inc.
- Candle Patterns
- Candlestick Charting Explained
- Intermarket Technical Analysis
- John Murphy on Chart Analysis
- John Murphy's Chart Pattern Recognition
- John Murphy's Market Message
- MurphyExplainsMarketAnalysis-Intermarket Analysis
- MurphyExplainsMarketAnalysis-Visual Analysis
- StockCharts.com
- Technical Analysis of the Financial Markets
- The Visual Investor
- VectorVest, Inc.
- Executive Premier Workshop
- One-Day Options Course
- OptionsPro
- Retirement Income Workshop
- Sure-Fire Trading Systems (VectorVest, Inc.)
- Trading as a Business Workshop
- VectorVest 7 EOD
- VectorVest 7 RealTime/IntraDay
- VectorVest AutoTester
- VectorVest Educational Services
- VectorVest OnLine
- VectorVest Options Analyzer
- VectorVest ProGraphics v6.0
- VectorVest ProTrader 7
- VectorVest RealTime Derby Tool
- VectorVest Simulator
- VectorVest Variator
- VectorVest Watchdog
