HOT TOPICS LIST
- MACD
- Fibonacci
- RSI
- Gann
- ADXR
- Stochastics
- Volume
- Triangles
- Futures
- Cycles
- Volatility
- ZIGZAG
- MESA
- Retracement
- Aroon
INDICATORS LIST
LIST OF TOPICS
PRINT THIS ARTICLE
by Donald W. Pendergast, Jr.
After plunging by 45% between February and October 2010, shares of JPMorgan Chase have rebounded sharply. However, prices may soon be due for a pullback over the next month or so.
Position: N/A
Donald W. Pendergast, Jr.
Donald W. Pendergast is a financial markets consultant who offers specialized services to stock brokers and high net worth individuals who seek a better bottom line for their portfolios.
PRINT THIS ARTICLE
CYCLES
JPM Pullback Toward Expected Cycle Low Due?
03/26/12 01:07:03 PMby Donald W. Pendergast, Jr.
After plunging by 45% between February and October 2010, shares of JPMorgan Chase have rebounded sharply. However, prices may soon be due for a pullback over the next month or so.
Position: N/A
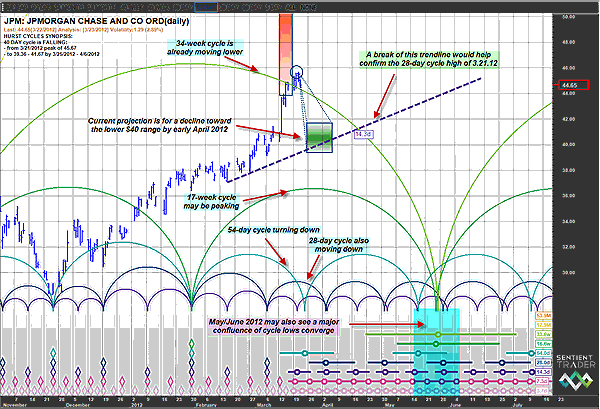
| One thing about stocks from the banking industry group is certain: they can and do make marvelous trending moves on a regular basis, be it bullish or bearish. As such, they can be prime profit opportunity centers for your trading portfolio. The common shares of JPMorgan Chase (JPM), one of the US's largest banking establishments, may soon be offering nimble traders a shot at a new shorting opportunity, and patient traders/investors may get another chance to get on board during next month's anticipated cycle low. Here's a closer look now (Figure 1). |

|
| FIGURE 1: JPM, DAILY. With three of the cycles shown already falling and another one projected to peak soon, existing long positions in JPM might do well to either begin scaling out of and/or more closely protecting their existing long positions. Early to mid-April 2012 may offer another chance to get on another upleg. |
| Graphic provided by: Sentient Trader. |
| |
| Price cycle analysis reveals that a number of cycles are at work in the everyday price action in JPM; currently, cycle lows of 3.7, 7.3, 14.3, 28 and 54 days have been identified, along with several other large-scale cycles. If you look at the daily price chart of JPM, you can easily discern that the 28- and 54-day cycles have already peaked and are starting to turn sharply lower and that the 17-week cycle may soon be peaking. In addition, the 34-week cycle has already peaked and is moving lower. Cycle analysis is not always a precise market science (and neither is any other method, be it Elliott wave, Gann, or Fibonacci, or any other), but when the majority of the main identified cycles are all in general agreement that a significant swing high in the price of a stock has been made, it's usually wise to pay close attention. On the chart we also see the general time/price confluence zone where JPM may be expected to find cycle low support in the lower $40 range, perhaps by the early part of April 2012. Note that the valid trendline (VTL) that connects the 28-day cycle lows also is projected to offer price support at the lower range of the green time/price support zone. Glancing at the lower right portion of the chart, we also find that there are a good many anticipated cycle lows all converging in the May-June 2012 time window (blue shaded area), something else to be aware of if you regularly trade JPM. |

|
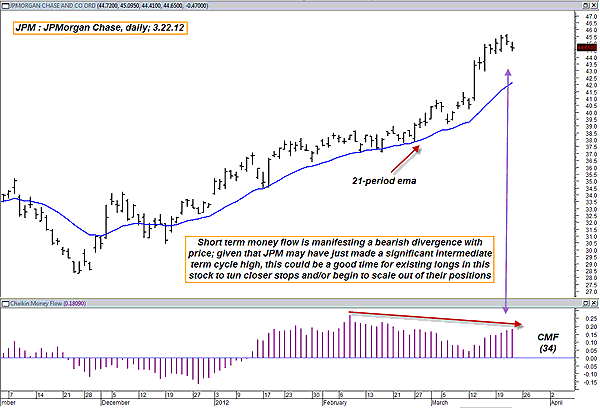
| FIGURE 2: JPM, DAILY. With money flow failing to keep up with JPM's recent rise, yet another clue as to the most probable near-term direction of JPM may be seen here. |
| Graphic provided by: MetaStock. |
| |
| As for other noncyclical evidence that may help support the idea that JPM actually did peak on March 21, 2012, take a look at this daily chart, which shows the bearish price/money flow divergence in JPM (Figure 2). The 34-period Chaikin money flow histogram (CMF)(34) had clearly parted ways with JPM's most recent uptrend, failing to make a new high along with JPM's share price. Overall, the cyclical and money flow picture does seem to put the odds in favor of JPM pulling back into the lower $40s within the next two weeks, so if you are already long this stock, you may wish to start scaling out of your position and/or begin running a closer trailing stop. By the way, both the .SPX and .RUT each feature falling 40-day price cycles that also generally coincide with the cycle analysis depicted here for JPM. If such an early April cycle low holds, the quality of any rally higher will mainly depend on the quality of the earnings reports in April. It should be an interesting time in the broad markets, especially if earnings are much better -- or worse -- than expected. |
Donald W. Pendergast is a financial markets consultant who offers specialized services to stock brokers and high net worth individuals who seek a better bottom line for their portfolios.
| Title: | Writer, market consultant |
| Company: | Linear Trading Systems LLC |
| Jacksonville, FL 32217 | |
| Phone # for sales: | 904-239-9564 |
| E-mail address: | lineartradingsys@gmail.com |
Traders' Resource Links | |
| Linear Trading Systems LLC has not added any product or service information to TRADERS' RESOURCE. | |
Click here for more information about our publications!
PRINT THIS ARTICLE

Request Information From Our Sponsors
- StockCharts.com, Inc.
- Candle Patterns
- Candlestick Charting Explained
- Intermarket Technical Analysis
- John Murphy on Chart Analysis
- John Murphy's Chart Pattern Recognition
- John Murphy's Market Message
- MurphyExplainsMarketAnalysis-Intermarket Analysis
- MurphyExplainsMarketAnalysis-Visual Analysis
- StockCharts.com
- Technical Analysis of the Financial Markets
- The Visual Investor
- VectorVest, Inc.
- Executive Premier Workshop
- One-Day Options Course
- OptionsPro
- Retirement Income Workshop
- Sure-Fire Trading Systems (VectorVest, Inc.)
- Trading as a Business Workshop
- VectorVest 7 EOD
- VectorVest 7 RealTime/IntraDay
- VectorVest AutoTester
- VectorVest Educational Services
- VectorVest OnLine
- VectorVest Options Analyzer
- VectorVest ProGraphics v6.0
- VectorVest ProTrader 7
- VectorVest RealTime Derby Tool
- VectorVest Simulator
- VectorVest Variator
- VectorVest Watchdog
