HOT TOPICS LIST
- MACD
- Fibonacci
- RSI
- Gann
- ADXR
- Stochastics
- Volume
- Triangles
- Futures
- Cycles
- Volatility
- ZIGZAG
- MESA
- Retracement
- Aroon
INDICATORS LIST
LIST OF TOPICS
PRINT THIS ARTICLE
by Donald W. Pendergast, Jr.
With shares of Apple Inc. now going nearly vertical, it's time to take a step back and look at the big picture.
Position: N/A
Donald W. Pendergast, Jr.
Donald W. Pendergast is a financial markets consultant who offers specialized services to stock brokers and high net worth individuals who seek a better bottom line for their portfolios.
PRINT THIS ARTICLE
ACCUM./DIST. CHAIKIN
AAPL's Faltering Money Flow
03/23/12 10:11:43 AMby Donald W. Pendergast, Jr.
With shares of Apple Inc. now going nearly vertical, it's time to take a step back and look at the big picture.
Position: N/A
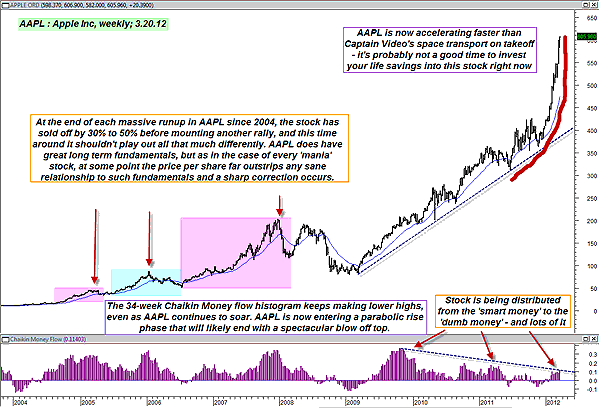
| A few days ago, I posted an article dealing with the anticipated price cycles for Apple shares (AAPL), one that offered a reasonably convincing case for a near-term descent by the stock into the lower half of the $500 price range by sometime in April 2012. Here's a different technical view of AAPL, this time on its weekly chart (Figure 1); taken as a whole, the cyclical and money flow situation in this high-flying tech issue really do seem to point toward another pullback, if not an outright selloff in the near future. Here's a closer look now. |

|
| FIGURE 1: AAPL, WEEKLY. Price/money flow divergences won't necessarily help you call every exact turn in a given market, but they can definitely help you determine if the smart money is accumulating or distributing stock, and at what rate. |
| Graphic provided by: MetaStock. |
| |
| Even with AAPL's cyclical analysis suggesting a near-term decline is likely anytime now, it's still a wise course of action to check the long-term money flow situation to see if the stock is exhibiting any evidence of negative price/money flow divergence, which would also help confirm the fact that holders of large amounts of AAPL have been gradually selling or distributing their shares into the market over a period of time. Looking at a weekly chart of the stock, one that has the 34-period Chaikin money flow (CMF)(34) histogram applied to it, we can easily see that even as AAPL has been rocketing higher. The peaks on the money flow histogram have been occurring at progressively lower levels, clearly indicating that this mega-rally is likely much closer to its end than its beginning. Glancing on the left portion of Figure 2, we also find that AAPL has experienced several other giant rallies since 2004, and that each of them, without fail, led to sharp declines of 30% to 50% in the weeks after the ultimate high for each rally was complete. This chart is a near-textbook quality depiction of how the forces of fear and greed move stock prices in such a powerful fashion. Most analysts will agree that AAPL is a well-run company with excellent earnings growth projections, and therefore it's simply expected that the stock of such a company should rise in price. And everyone just "knows" what a big deal the latest iPad, iPhone, or what have you is simply something that "everyone" will want, and therefore the stock price is justified in going even higher. People use this reasoning as they pile into the stock during its final, parabolic rise just before a blowoff top, and then they wonder why the stock price quickly loses as much as half of its value in a matter of months (or even weeks), leaving them with a trashed trading account and bitter speculations that the market is somehow rigged or is unfair to ordinary traders and investors. Yet, had these same traders/investors taken the time to examine the long-term money flow for such a stock (and as AAPL may soon become, for all we know), they would have been able to see the ongoing process of distribution at work, where big chunks of stock held by institutions are being gradually and steadily sold into the market -- even as the price continues to rise. This is exactly what's going on with AAPL and has been for quite some time. Pretty soon, the last of the buyers will purchase his or her 10-, 20-, or even 50-share stake in this stock, only to watch in horror as it drops by perhaps $30, $40, or even $50 in one session, with an avalanche of further selling unleashed in the wake of such a run for the market exits. And yet, the evidence warning of such a selloff was right there all the time on the charts, more than willing to give insight to those willing to take the time to understand the implications of such evidence. |
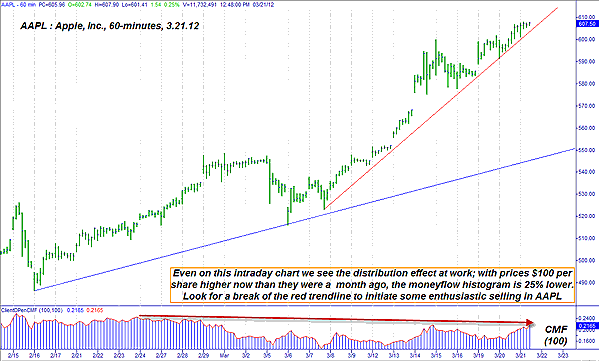
| Making predictions regarding the exact time/price area that a stock will top or bottom out is a fool's game, but you can still put the probabilities for trading/investing success more squarely in your favor by checking to see if a stock is in the accumulation or distribution phase (Figure 2). If you can learn to master this essential market skill, you'll be far ahead of the game compared to the average uninformed market participants who always seem to end up as victims of their better-informed (and usually better-capitalized) competitors in the market. So, decide right now that you're going to wise up and stop playing the fool, and that you're going to make 2012 the year you learn how to get on and stay on the right side of most markets, at least most of the time. |

|
| FIGURE 2: AAPL, HOURLY. Higher prices + an accelerating uptrend + progressively weakening money flow = Distribution of some degree is under way. |
| Graphic provided by: TradeStation. |
| |
Donald W. Pendergast is a financial markets consultant who offers specialized services to stock brokers and high net worth individuals who seek a better bottom line for their portfolios.
| Title: | Writer, market consultant |
| Company: | Linear Trading Systems LLC |
| Jacksonville, FL 32217 | |
| Phone # for sales: | 904-239-9564 |
| E-mail address: | lineartradingsys@gmail.com |
Traders' Resource Links | |
| Linear Trading Systems LLC has not added any product or service information to TRADERS' RESOURCE. | |
Click here for more information about our publications!
Comments

Request Information From Our Sponsors
- StockCharts.com, Inc.
- Candle Patterns
- Candlestick Charting Explained
- Intermarket Technical Analysis
- John Murphy on Chart Analysis
- John Murphy's Chart Pattern Recognition
- John Murphy's Market Message
- MurphyExplainsMarketAnalysis-Intermarket Analysis
- MurphyExplainsMarketAnalysis-Visual Analysis
- StockCharts.com
- Technical Analysis of the Financial Markets
- The Visual Investor
- VectorVest, Inc.
- Executive Premier Workshop
- One-Day Options Course
- OptionsPro
- Retirement Income Workshop
- Sure-Fire Trading Systems (VectorVest, Inc.)
- Trading as a Business Workshop
- VectorVest 7 EOD
- VectorVest 7 RealTime/IntraDay
- VectorVest AutoTester
- VectorVest Educational Services
- VectorVest OnLine
- VectorVest Options Analyzer
- VectorVest ProGraphics v6.0
- VectorVest ProTrader 7
- VectorVest RealTime Derby Tool
- VectorVest Simulator
- VectorVest Variator
- VectorVest Watchdog
