HOT TOPICS LIST
- MACD
- Fibonacci
- RSI
- Gann
- ADXR
- Stochastics
- Volume
- Triangles
- Futures
- Cycles
- Volatility
- ZIGZAG
- MESA
- Retracement
- Aroon
INDICATORS LIST
LIST OF TOPICS
PRINT THIS ARTICLE
by Donald W. Pendergast, Jr.
The R2K just broke higher out of an inverted head & shoulders pattern, but is this rally attempt too little, too late?
Position: N/A
Donald W. Pendergast, Jr.
Donald W. Pendergast is a financial markets consultant who offers specialized services to stock brokers and high net worth individuals who seek a better bottom line for their portfolios.
PRINT THIS ARTICLE
CYCLES
Is The Cycle High For .RUT?
03/22/12 01:23:19 PMby Donald W. Pendergast, Jr.
The R2K just broke higher out of an inverted head & shoulders pattern, but is this rally attempt too little, too late?
Position: N/A
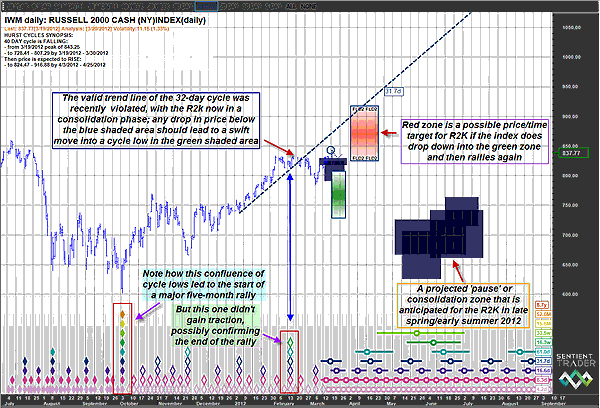
| It's always fun to look back on a price chart and to see how price action unfolded after a stock or futures market made an important multicycle low. In the case of the Russell 2000 index (.RUT, IWM), that major low was made on October 4, 2011, at a price of 60.09 (IWM), after which the market proceeded to rally (with some selloffs along the way, particularly in November 2011) for five months, ultimately peaking at 84.39 on March 19, 2012. That's a gain of more than 40%, or about 8% per month on average. Now, of course, human behavior being as it is, it's only natural to believe that such a rate of increase can continue indefinitely, but wise market technicians (and previously burned traders and investors) know that every strong rally will, at some point, come to an end. One of the more reliable methods of identifying (and hopefully profiting from) market price movements is to rely on cycle analysis, and in the case of IWM's daily chart, there are a number of technical clues that suggest that the five-month old party in this key small-cap stock index may just about be over. Here's a closer look now (Figure 1). |

|
| FIGURE 1: IWM, DAILY. Cycle analysis of the R2K suggests that a drop into the mid-700s by late March to early April 2012 (green zone on chart) is a very distinct possibility. |
| Graphic provided by: Sentient Trader. |
| |
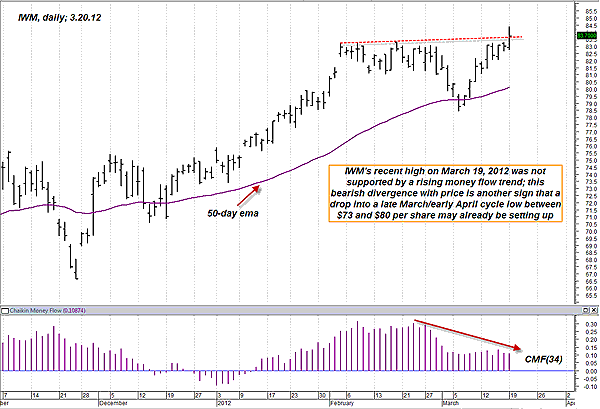
| There are a number of technicals working together, and here are the primary dynamics at work: Although the 16-week cycle, along with the daily 61-, 32-, 17-, eight-, and four-day cycles all agreed that February 15, 2012, was a significant cycle low in the IWM, the resulting price action failed to generate anything more than a tiny rally, which was quickly followed by the range-bound price action that we have seen for five weeks now (except for March 19's breakout attempt from an inverted head & shoulders pattern, that is). If IWM's underlying trend was still structurally sound, the February 15th cycle low should have launched another leg higher shortly thereafter. Since the result was the current consolidation along with a break of the valid 32-day cycle's trendline (dashed line on chart), the standard interpretation is that February's high was indeed the cycle top for the 32-day cycle (measured from trough to trough), and unless price soon breaks to new highs, that a drop into the projected multicycle low of 728.40 to 807.28 (basis .RUT) by the end of March 2012 becomes more probable with each passing day. For the moment, traders and investors need to see how the index reacts on any drop lower out of the current blue pause zone (between 791.00 and 830.00). If that drop below 791.00 occurs soon, then all systems are a go for the Russell 2000 index to quickly move down into the mid-to lower 700s, and in fairly short order. If you've been involved in trading and/or analyzing the markets for any length of time, then you're already aware that most markets tend to drop at a rate of speed/intensity that is usually at least two to three times faster than they rise, and that getting on the right side of such selloffs can be a potentially profitable activity. Figure 2 also provides another valuable technical tool regarding the R2K's next probable direction; the short-term Chaikin money flow (CMF)(34) histogram is manifesting a very pronounced, very bearish price/money flow divergence, one that is almost always present at significant market tops (of varying degree). All in all, this is a time to be very cautious about initiating new long positions in the US stock market, and existing longs should already be running some sort of a trailing stop or "go to flat in cash" strategy until the dynamics presented on these charts can work themselves out. |

|
| FIGURE 2: IWM, DAILY. Bearish price money flow divergence (price making a new swing high, but on declining money flow) is usually a tipoff that distribution is occurring -- stock is being transferred from strong hands to weak hands -- prior to a meaningful pullback or selloff. |
| Graphic provided by: Sentient Trader. |
| |
| The next few weeks should see some exciting moves -- in either direction -- in the US equities market, so be prepared, no matter what may happen. |
Donald W. Pendergast is a financial markets consultant who offers specialized services to stock brokers and high net worth individuals who seek a better bottom line for their portfolios.
| Title: | Writer, market consultant |
| Company: | Linear Trading Systems LLC |
| Jacksonville, FL 32217 | |
| Phone # for sales: | 904-239-9564 |
| E-mail address: | lineartradingsys@gmail.com |
Traders' Resource Links | |
| Linear Trading Systems LLC has not added any product or service information to TRADERS' RESOURCE. | |
Click here for more information about our publications!
Comments

Request Information From Our Sponsors
- StockCharts.com, Inc.
- Candle Patterns
- Candlestick Charting Explained
- Intermarket Technical Analysis
- John Murphy on Chart Analysis
- John Murphy's Chart Pattern Recognition
- John Murphy's Market Message
- MurphyExplainsMarketAnalysis-Intermarket Analysis
- MurphyExplainsMarketAnalysis-Visual Analysis
- StockCharts.com
- Technical Analysis of the Financial Markets
- The Visual Investor
- VectorVest, Inc.
- Executive Premier Workshop
- One-Day Options Course
- OptionsPro
- Retirement Income Workshop
- Sure-Fire Trading Systems (VectorVest, Inc.)
- Trading as a Business Workshop
- VectorVest 7 EOD
- VectorVest 7 RealTime/IntraDay
- VectorVest AutoTester
- VectorVest Educational Services
- VectorVest OnLine
- VectorVest Options Analyzer
- VectorVest ProGraphics v6.0
- VectorVest ProTrader 7
- VectorVest RealTime Derby Tool
- VectorVest Simulator
- VectorVest Variator
- VectorVest Watchdog
