HOT TOPICS LIST
- MACD
- Fibonacci
- RSI
- Gann
- ADXR
- Stochastics
- Volume
- Triangles
- Futures
- Cycles
- Volatility
- ZIGZAG
- MESA
- Retracement
- Aroon
INDICATORS LIST
LIST OF TOPICS
PRINT THIS ARTICLE
by Chaitali Mohile
Although certain candlestick formations are commonly found on technical charts, they do affect the price rally.
Position: N/A
Chaitali Mohile
Active trader in the Indian stock markets since 2003 and a full-time writer. Trading is largely based upon technical analysis.
PRINT THIS ARTICLE
CANDLESTICK CHARTING
Strength Of Reversal Candlestick Pattern
03/21/12 01:57:27 PMby Chaitali Mohile
Although certain candlestick formations are commonly found on technical charts, they do affect the price rally.
Position: N/A
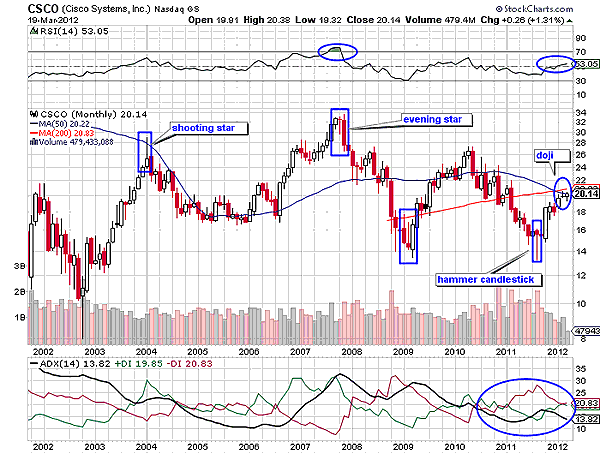
| A morning star, an evening star, a hammer, a hanging man, and a shooting star are some of the candlestick formations that are often formed on technical charts. Each of the candlestick patterns has robust bullish/bearish strength to reverse the existing rally. The monthly chart of Cisco Systems (CSCO)seen here can help us understand the intensity of some of these candlestick patterns. The monthly time frame charts are used to review long-term trends and stability of the rally, while the effects of candlestick patterns also last for longer periods. Note a shooting star candlestick pattern formed in 2004. This single candlestick is a bearish reversal formation, which converted the bullish rally of CSCO to a fresh bearish rally in Figure 1. The stock plunged to $18 from $30. It is always advisable to combine the single candlestick with some reliable oscillators like relative strength index (RSI), rate of change (ROC), moving average convergence/divergence (MACD) (12,26,9), and so forth. To know the trend direction, the average directional index (ADX) (14) is one of most reliable oscillators. |
| After descending from $30, CSCO established support at the 50-day moving average (MA). The relative strength index (14) in Figure 1 was not ready to breach the center line support at 50 level, indicating stable bullish pressure. The selling pressure indicated by the red line in the ADX (14) remained steady and moved with equal pace of the buying pressure (see the green line). Once CSCO established support, it initiated a pullback rally. The stock then formed a new high at $34 levels. The majority of the bullish candlesticks formed during the pullback rally have upper shadows, reflecting that it is unlikely the highs will hold. At 34 levels, CSCO formed an evening star candlestick pattern -- a bearish reversal pattern. The overbought RSI (14) and the overheated ADX (14) confirmed the reversal pattern in Figure 1. |

|
| FIGURE 1: CSCO, MONTHLY |
| Graphic provided by: StockCharts.com. |
| |
| The evening star and morning star candlestick pattern are formations that are made up of three candlesticks. The first candle represents the current trend, the middle candlestick is always a doji, and the third candle reflects the new upcoming trend. A bearish rally initiated from the evening star candlestick pattern in late 2007 reversed at the morning star formation in early 2009 in Figure 1. Although a fresh bullish rally had started, there was lack of bullish force in the new journey; CSCO descended from the 28 levels. |
| This rally breached the 50-day and 200-day MA, indicating huge bearish pressure. However, a hammer formed at the previous low support (14 levels). Although a hammer and hanging man are similar-looking single candlestick formations, they appear in different trends. The hammer pattern is formed at the bottom of a bearish rally, while the hanging man formation is formed at the top of a bullish rally. An existing downtrend reverses at the hammer candlestick formation, whereas a bullish trend terminates at the hanging man. |
| In Figure 1, notice the hammer candlestick pattern at the end of the bearish rally, which marked the beginning of the bullish move. Unfortunately, the formation could not reverse the weak trend to bullish. The RSI (14) is also reluctant to surge above 50 levels. The indicators and the candlestick showed us the road map of CSCO. Though the hammer pattern was formed at the support level, the weak indicators failed to add momentum in the rally. The weakness resulted in the formation of two dojis under the resistance of the two moving averages. To conclude, the strength of the candlestick formation can be better understood by a combination of technical indicators. |
Active trader in the Indian stock markets since 2003 and a full-time writer. Trading is largely based upon technical analysis.
| Company: | Independent |
| Address: | C1/3 Parth Indraprasth Towers. Vastrapur |
| Ahmedabad, Guj 380015 | |
| E-mail address: | chaitalimohile@yahoo.co.in |
Traders' Resource Links | |
| Independent has not added any product or service information to TRADERS' RESOURCE. | |
Click here for more information about our publications!
Comments

Request Information From Our Sponsors
- StockCharts.com, Inc.
- Candle Patterns
- Candlestick Charting Explained
- Intermarket Technical Analysis
- John Murphy on Chart Analysis
- John Murphy's Chart Pattern Recognition
- John Murphy's Market Message
- MurphyExplainsMarketAnalysis-Intermarket Analysis
- MurphyExplainsMarketAnalysis-Visual Analysis
- StockCharts.com
- Technical Analysis of the Financial Markets
- The Visual Investor
- VectorVest, Inc.
- Executive Premier Workshop
- One-Day Options Course
- OptionsPro
- Retirement Income Workshop
- Sure-Fire Trading Systems (VectorVest, Inc.)
- Trading as a Business Workshop
- VectorVest 7 EOD
- VectorVest 7 RealTime/IntraDay
- VectorVest AutoTester
- VectorVest Educational Services
- VectorVest OnLine
- VectorVest Options Analyzer
- VectorVest ProGraphics v6.0
- VectorVest ProTrader 7
- VectorVest RealTime Derby Tool
- VectorVest Simulator
- VectorVest Variator
- VectorVest Watchdog
