HOT TOPICS LIST
- MACD
- Fibonacci
- RSI
- Gann
- ADXR
- Stochastics
- Volume
- Triangles
- Futures
- Cycles
- Volatility
- ZIGZAG
- MESA
- Retracement
- Aroon
INDICATORS LIST
LIST OF TOPICS
PRINT THIS ARTICLE
by Mike Carr, CMT
Traders often assume overbought markets are ready to decline, but as the S&P 500 has shown in 2012, markets can stay overbought for extended periods.
Position: Buy
Mike Carr, CMT
Mike Carr, CMT, is a member of the Market Technicians Association, and editor of the MTA's newsletter, Technically Speaking. He is also the author of "Smarter Investing in Any Economy: The Definitive Guide to Relative Strength Investing," and "Conquering the Divide: How to Use Economic Indicators to Catch Stock Market Trends."
PRINT THIS ARTICLE
CHART ANALYSIS
Overbought Stock Market Doesn't Mean Sell
03/21/12 12:39:40 PMby Mike Carr, CMT
Traders often assume overbought markets are ready to decline, but as the S&P 500 has shown in 2012, markets can stay overbought for extended periods.
Position: Buy
| When traders first start studying technical analysis, they tend to be amazed at how precisely some indicators work. In books and on websites, the "well-selected example" tends to be used to illustrate the concepts of overbought and oversold. Invariably, overbought markets decline and oversold indicators pinpoint the start of a new bull market. In real life, it seldom works that way. The great economist John Maynard Keynes is credited with saying, "The market can stay irrational longer than you can stay solvent," and although Keynesian economics has led to many debates, this simple market observation is a basic truth that traders need to learn. |
| Test results show that traders cannot rely on simple indicators to beat the market. The relative strength index (RSI) is a popular indicator. When it was originally introduced, J. Welles Wilder defined the overbought level as 70 and the oversold level as 30. Testing that idea on the SPY, an exchange traded fund (ETF) that tracks the Standard & Poor's 500, shows that an always-in-the-market strategy would result in trades that were winners 59% of the time, but overall, the system loses money. One problem is that the RSI doesn't always offer timely signals. For example, the system signaled a short entry in November 1999 and endured a steep drawdown as the market peaked about five months later and then closed the position at a small profit in October 2000. |
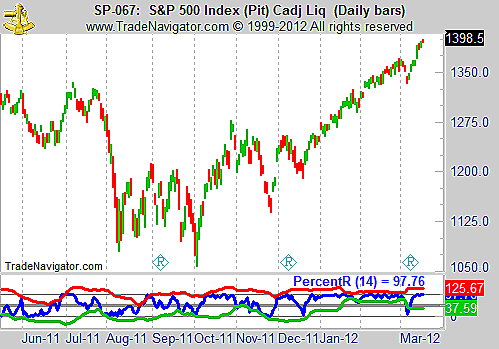
| A winning market analysis needs to have more complexity than simple and unchanging overbought and oversold levels. It is also often beneficial to study less widely followed indicators. Williams' PercentR is a well-designed indicator that is not as widely followed as stochastics or RSI but often provides timely trade signals. That indicator is shown in Figure 1 on a daily chart of the SPY. |

|
| FIGURE 1: SPY, DAILY. PercentR has remained at a high level but never became overbought in the stock market rally that began in late 2011. "Overbought" would be defined as the indicator breaking above its upper Bollinger Band. |
| Graphic provided by: Trade Navigator. |
| |
| Bollinger Bands have been added to the indicator. This eliminates the need for a predefined level of overbought and oversold. An indicator is considered to be at an extreme when it breaks a band. "Oversold" in this case would mean that the indicator is below the lower band and overbought markets are defined as when the indicator moves above the upper band. By that definition, SPY has not become overbought in 2012. The brief selloff in early March pushed PercentR below the lower band and offered traders a buy signal when it rebounded sharply. The weekly chart of SPY can be seen in Figure 2. |

|
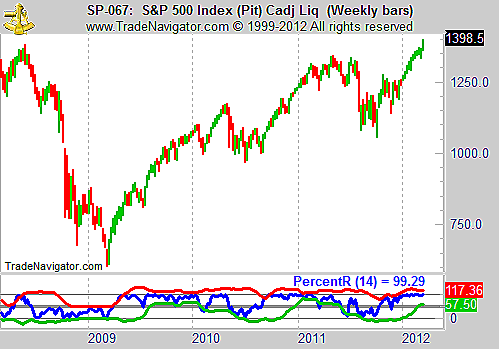
| FIGURE 2: SPY, WEEKLY. The weekly chart of SPY confirms that the market gains did not push the market into an overbought condition. |
| Graphic provided by: Trade Navigator. |
| |
| In the weekly time frame, SPY has also failed to reach an overbought level. The market rally has been strong in both time frames with PercentR near its maximum value of 100 for most of the bull move. Many traders and market analysts have questioned the health of the market, but stocks have posted double-digit gains despite the overbought readings on many standard indicators. To avoid missing out on the large gains that come after a market becomes overbought, traders can add Bollinger Bands to any indicator. There will be fewer signals, but they will be more accurate and profitable. Using this simple strategy on SPY, traders would see 63% of their trades make money and the system overall delivering positive results. Refinements to the strategy would offer greater returns and reduce the risk. |
Mike Carr, CMT, is a member of the Market Technicians Association, and editor of the MTA's newsletter, Technically Speaking. He is also the author of "Smarter Investing in Any Economy: The Definitive Guide to Relative Strength Investing," and "Conquering the Divide: How to Use Economic Indicators to Catch Stock Market Trends."
| Website: | www.moneynews.com/blogs/MichaelCarr/id-73 |
| E-mail address: | marketstrategist@gmail.com |
Click here for more information about our publications!
PRINT THIS ARTICLE

|

Request Information From Our Sponsors
- StockCharts.com, Inc.
- Candle Patterns
- Candlestick Charting Explained
- Intermarket Technical Analysis
- John Murphy on Chart Analysis
- John Murphy's Chart Pattern Recognition
- John Murphy's Market Message
- MurphyExplainsMarketAnalysis-Intermarket Analysis
- MurphyExplainsMarketAnalysis-Visual Analysis
- StockCharts.com
- Technical Analysis of the Financial Markets
- The Visual Investor
- VectorVest, Inc.
- Executive Premier Workshop
- One-Day Options Course
- OptionsPro
- Retirement Income Workshop
- Sure-Fire Trading Systems (VectorVest, Inc.)
- Trading as a Business Workshop
- VectorVest 7 EOD
- VectorVest 7 RealTime/IntraDay
- VectorVest AutoTester
- VectorVest Educational Services
- VectorVest OnLine
- VectorVest Options Analyzer
- VectorVest ProGraphics v6.0
- VectorVest ProTrader 7
- VectorVest RealTime Derby Tool
- VectorVest Simulator
- VectorVest Variator
- VectorVest Watchdog
