HOT TOPICS LIST
- MACD
- Fibonacci
- RSI
- Gann
- ADXR
- Stochastics
- Volume
- Triangles
- Futures
- Cycles
- Volatility
- ZIGZAG
- MESA
- Retracement
- Aroon
INDICATORS LIST
LIST OF TOPICS
PRINT THIS ARTICLE
by Donald W. Pendergast, Jr.
In a mammoth runup, how much higher does Apple really have left to run?
Position: Sell
Donald W. Pendergast, Jr.
Donald W. Pendergast is a financial markets consultant who offers specialized services to stock brokers and high net worth individuals who seek a better bottom line for their portfolios.
PRINT THIS ARTICLE
CYCLES
Market Taking A Bite Out Of Apple?
03/20/12 08:36:02 AMby Donald W. Pendergast, Jr.
In a mammoth runup, how much higher does Apple really have left to run?
Position: Sell
| No doubt about it, Apple Inc. (AAPL) may be the premier technology innovator of them all, routinely inventing new products for markets few ever envisioned ever becoming reality. Earnings growth remains strong, and that is the primary catalyst for the ongoing buying frenzy in shares of this large-cap tech titan. However, careful analysis of the stock's daily chart reveals that, at the very least, AAPL may soon pause its incredible uptrend and perhaps pull back into a significant cluster of cycle lows. Here's a closer look now (Figure 1). |

|
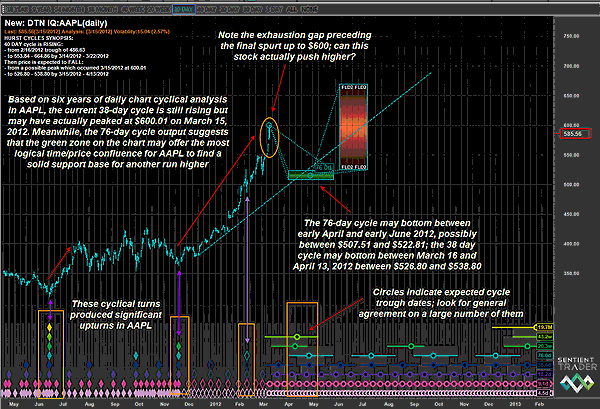
| FIGURE 1: AAPL, DAILY. Cyclical analysis on AAPL's daily chart reveals that April-May 2012 may see a pullback by the stock into a significant cycle low, one that may already be anticipated by as many as seven different price cycles. |
| Graphic provided by: Sentient Trader and DTNIQ. |
| |
| Starting with a daily chart of AAPL, I conducted a price cycle analysis beginning in March 2006 through the close of trading on Thursday, March 15, 2012. The results of the analysis are displayed on the chart, and the bulk of it seems to suggest that AAPL is either at or very near to a decline into a significant series of cycle lows. Let's look at the price chart itself. Do you see the exhaustion gap, one that occurred as the stock leaped higher toward $600 per share? An exhaustion gap is typically a reliable warning that a parabolic uptrend is just about to lose its upward momentum before stalling and then reversing lower. The fact that stock prices that are in multiples of $10 or $100 also frequently serve as powerful psychological support/resistance levels also appears to come into play here on AAPL's daily graph. Now, back to the actual cycles analysis; the Sentient Trader (ST intraday version) software automatically calculates the cycles, but I still had to use some common sense regarding: 1. How long a daily data series went to test 2. How to determine a significant swing low point near the start of that series. I chose to work with six years of daily data since it featured several strong bull, bear, and sideways market phases and was long enough to produce statistically useful results, particularly on the lower degree cycles. ST identified price cycles of 4.5, 9.1, 18.2, 38.4, and 76.0 days as well as higher cycles of 20.3 and 43.2 weeks, respectively. It also located a 19.7-month price cycle, too. Essentially, if a wise and logical starting point for the analysis has been chosen, ST will use its algorithms to make sense out of all of that cyclic data and then display it on the chart. In retrospect, we see that a couple of highly correlated cycle troughs were located in June to November 2011 and more recently in February 2012, with sizable bullish moves occurring in their respective wakes. |

|
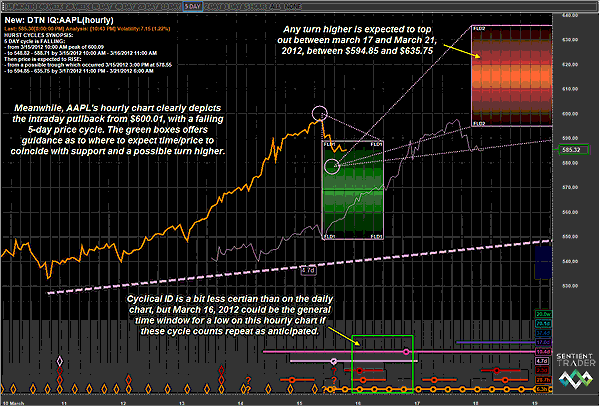
| FIGURE 2: AAPL, HOURLY. Price cycle ID is a bit less robust on this hourly chart, and this analysis also allows for a rise back above $600.01, but no later than March 21, 2012. |
| Graphic provided by: Sentient Trader and DTNIQ.. |
| |
| While the current 38.4-day cycle is still rising, the intraday high of $600.01 on March 15 has been identified as the possible peak of the entire runup since November 2011, and current longs in AAPL should begin to consider lightening up and/or running a much closer trailing stop. A possible target zone for a retracement is shown in green on the chart; based on a 76-day cycle, it suggests that a major swing low could bottom out in the lower $500 area even as the smaller 38.4-day cycle suggests that a low can be achieved between March 16 and April 13, 2012, also in the lower third of the $500 price range. Looking beneath the green box, the colored circles are starting to line up (more is better, as it may lead to a more accurate projection) in anticipation of a cycle low on the way. Finally, note the dashed trendline, one based off of the 76.4-day price cycle; it coincides with the same general time/price zone as the 76.4-day cycle low projection zone. How will this all play out? No one knows, but the cycle analysis suggests that at the very least, existing holders of AAPL take at least some protective measures and it may also be wise to delay additional purchases of the stock until after the stock pulls back and/or consolidates. By the way, the same sort of cycles work on AAPL's hourly chart (see Figure 2) is also suggestive of a further decline, but it allows for the possibility of a rise above $600.01 by no later than March 21, 2012. These are surely going to be interesting days for AAPL traders and investors over the next few weeks, that much is for certain! |
Donald W. Pendergast is a financial markets consultant who offers specialized services to stock brokers and high net worth individuals who seek a better bottom line for their portfolios.
| Title: | Writer, market consultant |
| Company: | Linear Trading Systems LLC |
| Jacksonville, FL 32217 | |
| Phone # for sales: | 904-239-9564 |
| E-mail address: | lineartradingsys@gmail.com |
Traders' Resource Links | |
| Linear Trading Systems LLC has not added any product or service information to TRADERS' RESOURCE. | |
Click here for more information about our publications!
PRINT THIS ARTICLE

Request Information From Our Sponsors
- VectorVest, Inc.
- Executive Premier Workshop
- One-Day Options Course
- OptionsPro
- Retirement Income Workshop
- Sure-Fire Trading Systems (VectorVest, Inc.)
- Trading as a Business Workshop
- VectorVest 7 EOD
- VectorVest 7 RealTime/IntraDay
- VectorVest AutoTester
- VectorVest Educational Services
- VectorVest OnLine
- VectorVest Options Analyzer
- VectorVest ProGraphics v6.0
- VectorVest ProTrader 7
- VectorVest RealTime Derby Tool
- VectorVest Simulator
- VectorVest Variator
- VectorVest Watchdog
- StockCharts.com, Inc.
- Candle Patterns
- Candlestick Charting Explained
- Intermarket Technical Analysis
- John Murphy on Chart Analysis
- John Murphy's Chart Pattern Recognition
- John Murphy's Market Message
- MurphyExplainsMarketAnalysis-Intermarket Analysis
- MurphyExplainsMarketAnalysis-Visual Analysis
- StockCharts.com
- Technical Analysis of the Financial Markets
- The Visual Investor
