HOT TOPICS LIST
- MACD
- Fibonacci
- RSI
- Gann
- ADXR
- Stochastics
- Volume
- Triangles
- Futures
- Cycles
- Volatility
- ZIGZAG
- MESA
- Retracement
- Aroon
INDICATORS LIST
LIST OF TOPICS
PRINT THIS ARTICLE
by Billy Williams
Points of price consolidation offer you a chance for a great entry into a fast-moving stock, and these three tips will help you time your entries with greater precision and possibly higher profits.
Position: Buy
Billy Williams
Billy Williams has been trading the markets for 27 years, specializing in momentum trading with stocks and options.
PRINT THIS ARTICLE
TECHNICAL ANALYSIS
Three Tips For Trading Consolidation Points
03/20/12 12:04:23 PMby Billy Williams
Points of price consolidation offer you a chance for a great entry into a fast-moving stock, and these three tips will help you time your entries with greater precision and possibly higher profits.
Position: Buy
| When sizing up the market for any trade using technical analysis, there are two types of price action: expansion and contraction. Expansion occurs when price is on the march and trending either up or down with a steady series of highs and lows in that direction. Contraction, however, occurs when price stops trending and trades back and forth until either the bulls or bears seize control of price, forcing it into a period of expansion again. It is during these periods where price consolidates its position and where the opportunity lies for a skilled trader to enter a low-risk position as price emerges into a period of expansion. See Figures 1 and 2. |
| First, what is price contraction? Price contraction occurs when trader and investor enthusiasm starts to cool on a given stock and disrupt its movement. If, for example, traders are bearish on a stock and speculators have been shorting the stock with conviction, they are forcing the stock into a period of price expansion to the downside; if at some point, good news on the company's prospects are announced or doubt begins to creep in the minds of the market's participants, then it could slow selling short the stock. It is at this point where the trend begins to slow and weaken, eventually entering into a period of contraction where price consolidates its gains and enters a type of holding pattern on the part of the traders who want to adopt a wait-and-see approach. |

|
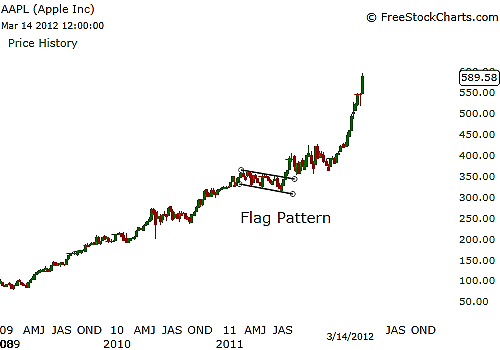
| FIGURE 1: AAPL, WEEKLY. On the weekly chart, price enters a period of contraction where it consolidates its gains and formed a flag pattern, a continuation pattern, from which point price emerges into a bullish period of expansion. |
| Graphic provided by: www.freestockcharts.com. |
| |
| Now that price movement has halted and is in a period of consolidation where traders are locking in profits but enough of them are holding positions to see what is happening next, you want to look for any signs of a chart pattern forming. There are two main types of chart patterns to be aware of: continuation and reversals. Continuation patterns form as the trend is in transition until it resumes its original move. These patterns include flags, pennants, triangles, and flat base patterns, to name a few of the most common forms. |

|
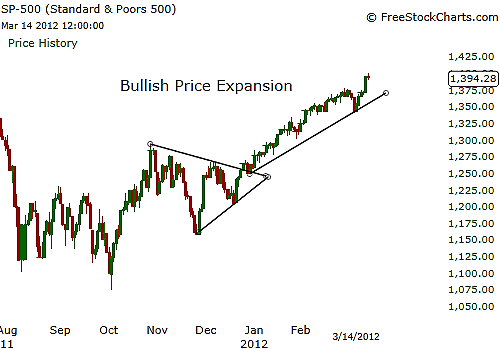
| FIGURE 2: SPX. The SPX formed a triangle pattern recently before entering a bullish period of price expansion. |
| Graphic provided by: www.freestockcharts.com. |
| |
| Reversal patterns reveal that the current trend is in trouble and is the stage flikely to reverse, setting or a change in the underlying dynamics of the original trend where a price movement is likely to change and reverse in the opposite direction. A few of these reversal chart patterns are the head & shoulders, double bottom, rising/falling wedges, and triple bottom. |
| To time the entry, you want to use a combination of price action and volume to enter as price emerges from one of these patterns into its original trend. Each pattern will have a unique set of guidelines as it moves back into expansion, but a good rule of thumb is that price will experience a volume surge of 150% on the day it moves through the upper or lower range of its chart pattern, depending on the context of the market that it finds itself in at the time. |
Billy Williams has been trading the markets for 27 years, specializing in momentum trading with stocks and options.
| Company: | StockOptionSystem.com |
| E-mail address: | stockoptionsystem.com@gmail.com |
Traders' Resource Links | |
| StockOptionSystem.com has not added any product or service information to TRADERS' RESOURCE. | |
Click here for more information about our publications!
PRINT THIS ARTICLE

Request Information From Our Sponsors
- StockCharts.com, Inc.
- Candle Patterns
- Candlestick Charting Explained
- Intermarket Technical Analysis
- John Murphy on Chart Analysis
- John Murphy's Chart Pattern Recognition
- John Murphy's Market Message
- MurphyExplainsMarketAnalysis-Intermarket Analysis
- MurphyExplainsMarketAnalysis-Visual Analysis
- StockCharts.com
- Technical Analysis of the Financial Markets
- The Visual Investor
- VectorVest, Inc.
- Executive Premier Workshop
- One-Day Options Course
- OptionsPro
- Retirement Income Workshop
- Sure-Fire Trading Systems (VectorVest, Inc.)
- Trading as a Business Workshop
- VectorVest 7 EOD
- VectorVest 7 RealTime/IntraDay
- VectorVest AutoTester
- VectorVest Educational Services
- VectorVest OnLine
- VectorVest Options Analyzer
- VectorVest ProGraphics v6.0
- VectorVest ProTrader 7
- VectorVest RealTime Derby Tool
- VectorVest Simulator
- VectorVest Variator
- VectorVest Watchdog
