HOT TOPICS LIST
- MACD
- Fibonacci
- RSI
- Gann
- ADXR
- Stochastics
- Volume
- Triangles
- Futures
- Cycles
- Volatility
- ZIGZAG
- MESA
- Retracement
- Aroon
INDICATORS LIST
LIST OF TOPICS
PRINT THIS ARTICLE
by Chaitali Mohile
Navios Maritime Partners is likely to turn weaker in the long run.
Position: N/A
Chaitali Mohile
Active trader in the Indian stock markets since 2003 and a full-time writer. Trading is largely based upon technical analysis.
PRINT THIS ARTICLE
CONSOLID FORMATION
NMM Stuck In Narrow Range
03/19/12 01:40:22 PMby Chaitali Mohile
Navios Maritime Partners is likely to turn weaker in the long run.
Position: N/A
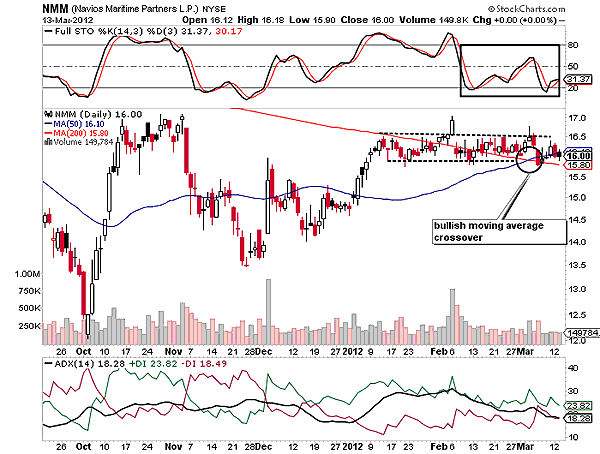
| Navios Maritime Partners (NMM) has been consolidating in a very narrow range between $16 and $16.50 for about two months. During consolidation, a stock accumulates the strength to resume its prior bullish or bearish rally. But if the consolidation period lasts for a longer period, the stock is likely to lose its control on the rally. The sideways price rally of NMM faced huge bearish pressure. We can see many red bearish candlesticks in the horizontal channel in Figure 1. The upper trendline resistance of the channel was touched twice; however, the high bearish force discouraged a bullish breakout of NMM. The second bullish candle that was trying to breach the resistance line is a shooting star candlestick pattern. This single candlestick pattern is a bearish reversal, and as a result, the stock resumed its volatile consolidation rally. |

|
| FIGURE 1: NMM, DAILY |
| Graphic provided by: StockCharts.com. |
| |
| The descending 200-day moving average (MA) led to a small bullish crossover in the price chart in Figure 1, and hence, the sideways action has major supports of the short-term as well as long-term moving average. The full stochastic (14,3,3) is fluctuating between the 50 and 30 levels, indicating a weak momentum and uncertain direction. The average directional index (ADX) (14) has slipped below 20 levels, signifying a weak trend. In such a scenario, a bullish breakout cannot be anticipated; in fact, the bearish strength is likely to increase in the price rally. NMM could plunge below the lower trendline support. |

|
| FIGURE 2: NMM, WEEKLY |
| Graphic provided by: StockCharts.com. |
| |
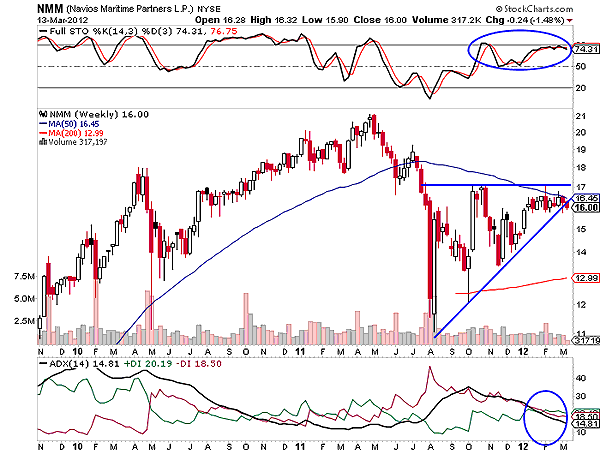
| The stock has formed an ascending triangle with a sharp buyer's line (lower line of the triangle) in Figure 2. Since the two trendlines are ready to intercept at one point, the triangle is likely to break out. But can we consider this triangle to be an ascending triangle -- a bullish trend reversal? The ascending triangle reverses the existing downtrend and starts a fresh bullish trend. The downtrend of NMM has dropped below 15 levels; the positive directional index (+DI) and the negative directional index (-DI) are tangled together in Figure 2. The stochastic oscillator is reluctant to surge above the 70 levels, highlighting a lack of bullish momentum. Thus, there are no downtrend reversal indications by the ADX (14) and the stochastic oscillator. |
| Since both indicators are showing signs of weakness, we cannot consider the triangle in Figure 2 to be an ascending one. Currently, the declining 50-day MA is suppressing the stock, trapping it in a very narrow range. If the price rally breaches the MA resistance, the upper trendline would be the second resistance for NMM. |
| Thus, the long consolidation period of NMM would turn weak, resulting in a bearish breakout in the near future. This breakout would attract fresh sellers and strengthen the new bearish rally. |
Active trader in the Indian stock markets since 2003 and a full-time writer. Trading is largely based upon technical analysis.
| Company: | Independent |
| Address: | C1/3 Parth Indraprasth Towers. Vastrapur |
| Ahmedabad, Guj 380015 | |
| E-mail address: | chaitalimohile@yahoo.co.in |
Traders' Resource Links | |
| Independent has not added any product or service information to TRADERS' RESOURCE. | |
Click here for more information about our publications!
PRINT THIS ARTICLE

Request Information From Our Sponsors
- StockCharts.com, Inc.
- Candle Patterns
- Candlestick Charting Explained
- Intermarket Technical Analysis
- John Murphy on Chart Analysis
- John Murphy's Chart Pattern Recognition
- John Murphy's Market Message
- MurphyExplainsMarketAnalysis-Intermarket Analysis
- MurphyExplainsMarketAnalysis-Visual Analysis
- StockCharts.com
- Technical Analysis of the Financial Markets
- The Visual Investor
- VectorVest, Inc.
- Executive Premier Workshop
- One-Day Options Course
- OptionsPro
- Retirement Income Workshop
- Sure-Fire Trading Systems (VectorVest, Inc.)
- Trading as a Business Workshop
- VectorVest 7 EOD
- VectorVest 7 RealTime/IntraDay
- VectorVest AutoTester
- VectorVest Educational Services
- VectorVest OnLine
- VectorVest Options Analyzer
- VectorVest ProGraphics v6.0
- VectorVest ProTrader 7
- VectorVest RealTime Derby Tool
- VectorVest Simulator
- VectorVest Variator
- VectorVest Watchdog
