HOT TOPICS LIST
- MACD
- Fibonacci
- RSI
- Gann
- ADXR
- Stochastics
- Volume
- Triangles
- Futures
- Cycles
- Volatility
- ZIGZAG
- MESA
- Retracement
- Aroon
INDICATORS LIST
LIST OF TOPICS
PRINT THIS ARTICLE
by Billy Williams
Despite a cynical outlook as 2012 began, the market has steadily risen but with pessimism in the air. The question remains: What lies on the road ahead?
Position: Buy
Billy Williams
Billy Williams has been trading the markets for 27 years, specializing in momentum trading with stocks and options.
PRINT THIS ARTICLE
TECHNICAL ANALYSIS
The Road Ahead
03/19/12 01:17:27 PMby Billy Williams
Despite a cynical outlook as 2012 began, the market has steadily risen but with pessimism in the air. The question remains: What lies on the road ahead?
Position: Buy
| With a tentative economic deal for Greece on the table as well as the job prospects in the US showing promise, the question for traders is, what lies on the road ahead? While it's hard to say if anything meaningful will come out of the Greek debt deal or the prospects of a US job market gathering strength, the optimism in the current bullish trend found in major indexes cannot be denied. In trading, trade where the trend tells you and if in doubt, step back and assess the situation. In that vein, let's look at what the market is actually doing versus focusing on what is causing it to trade in its current direction. See Figures 1, 2, and 3. |

|
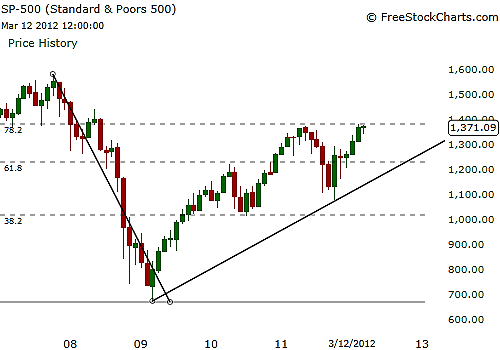
| FIGURE 1: S&P 500. While the road has been a rocky one, the SPX is now trading at the 0.782 Fibonacci retracement and is likely to challenge the highs set on October 31, 2007. |
| Graphic provided by: www.freestockcharts.com. |
| |
| First, look at the long-term trend of the stock market, or in this case, the SPX (Standard & Poor's 500). The quick method is the "eyeball," where you note whether price is starting at the lower-left hand side of the chart and trading toward the upper right-hand corner for a bull market. If price begins in the upper left-hand corner of the price chart and is trading down to the lower right-hand corner of the price chart, then it is a bearish market. Once you've identified the market context (bullish or bearish), spot the significant price highs and lows on the price chart. Since the current state of the SPX is bullish, take note of the price lows and draw a trendline from the lowest price low to the highest without drawing the trendline through any of the price action on the chart. |

|
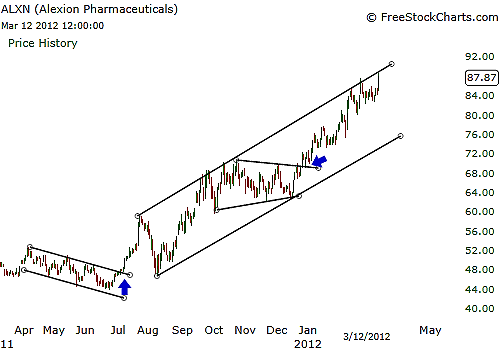
| FIGURE 2: ALXN. ALXN has been a strong stock leader that is likely to lead the market higher as it trades at its all-time price high and could break above its price channel's upper resistance. |
| Graphic provided by: www.freestockcharts.com. |
| |
| Next, you want to look where the SPX is in relation to any previous price highs in order to determine whether price might encounter resistance, which could impede its upward movement. In addition, it helps to know how far price has retraced from a previous decline using the identified previous price highs as the starting point. In this case, use the Fibonacci numbers to determine how far the SPX has retraced its downward move to gauge how strong the current bull run is so that you gain a sense of the market's conviction to the upside. Currently, the SPX is nearing its 0.782 retracement, also called the 80% point, and it is a strong indication that if price rises through this level, it has an 80% or better chance of challenging the previous price high at 1576, which was set on October 31, 2007. |

|
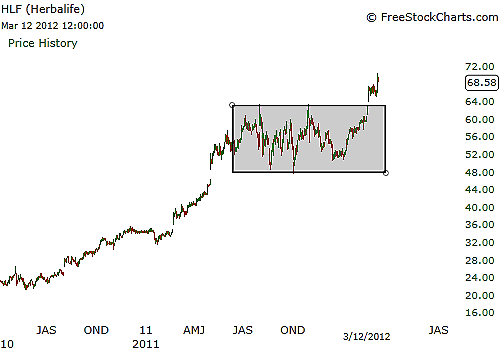
| FIGURE 3: HERBALIFE. HLF has been in a period of contraction for several months but has not emerged into expansion as it breaks out to a new all-time high. It appears to be morphing into a new stock leader that is ready to take the SPX back to its October 31, 2007, price high. |
| Graphic provided by: www.freestockcharts.com. |
| |
| Given that analysis, it looks like the market stands to gain some serious ground in the next several months. Historically, May has proven to be the most bullish month, with those leading up to it setting the stage for a strong bull run. That said, the next thing you want to do is look for stocks with the most compelling set of fundamental and technical factors to lead the market higher. To do so, look for stocks that have the strongest set of earnings and sales revenue that have been steadily increasing quarter-over-quarter and year-over-year reports along with little or no debt. |
| On the technical side, the biggest factor is to look for stocks that are near or at their all-time highs. While you want to catch stocks that are in a base pattern near their all-time highs for four to eight weeks, to catch a breakout, at times, is not practical because a stock leader is on the move, typically. However, pullbacks in price are common and by being prepared you can enter a move that is on the march upward when you've done your homework and got the winds of the SPX, or general market, at your back. |
Billy Williams has been trading the markets for 27 years, specializing in momentum trading with stocks and options.
| Company: | StockOptionSystem.com |
| E-mail address: | stockoptionsystem.com@gmail.com |
Traders' Resource Links | |
| StockOptionSystem.com has not added any product or service information to TRADERS' RESOURCE. | |
Click here for more information about our publications!
PRINT THIS ARTICLE

|

Request Information From Our Sponsors
- StockCharts.com, Inc.
- Candle Patterns
- Candlestick Charting Explained
- Intermarket Technical Analysis
- John Murphy on Chart Analysis
- John Murphy's Chart Pattern Recognition
- John Murphy's Market Message
- MurphyExplainsMarketAnalysis-Intermarket Analysis
- MurphyExplainsMarketAnalysis-Visual Analysis
- StockCharts.com
- Technical Analysis of the Financial Markets
- The Visual Investor
- VectorVest, Inc.
- Executive Premier Workshop
- One-Day Options Course
- OptionsPro
- Retirement Income Workshop
- Sure-Fire Trading Systems (VectorVest, Inc.)
- Trading as a Business Workshop
- VectorVest 7 EOD
- VectorVest 7 RealTime/IntraDay
- VectorVest AutoTester
- VectorVest Educational Services
- VectorVest OnLine
- VectorVest Options Analyzer
- VectorVest ProGraphics v6.0
- VectorVest ProTrader 7
- VectorVest RealTime Derby Tool
- VectorVest Simulator
- VectorVest Variator
- VectorVest Watchdog
