HOT TOPICS LIST
- MACD
- Fibonacci
- RSI
- Gann
- ADXR
- Stochastics
- Volume
- Triangles
- Futures
- Cycles
- Volatility
- ZIGZAG
- MESA
- Retracement
- Aroon
INDICATORS LIST
LIST OF TOPICS
PRINT THIS ARTICLE
by Donald W. Pendergast, Jr.
Shares of Darden Restaurants appear ready to move higher from a recent breakout pattern, but traders need to take a good look at other technicals before they go long.
Position: N/A
Donald W. Pendergast, Jr.
Donald W. Pendergast is a financial markets consultant who offers specialized services to stock brokers and high net worth individuals who seek a better bottom line for their portfolios.
PRINT THIS ARTICLE
BREAKOUTS
Get The Big Menu With Darden Restaurants
03/16/12 01:05:31 PMby Donald W. Pendergast, Jr.
Shares of Darden Restaurants appear ready to move higher from a recent breakout pattern, but traders need to take a good look at other technicals before they go long.
Position: N/A
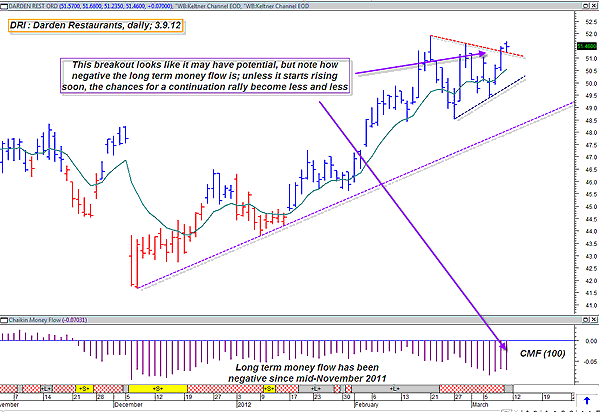
| The common stock of Darden Restaurants (DRI) enjoyed a nice, steady rise from early December 2011 until mid-February 2012, gaining more than 24% during that time. Now, with the stock seemingly ready to prepare for a possible continuation move higher, traders are watching to see if the recent consolidation breakout is for real. While the strength of the uptrend leading into the consolidation cannot be questioned, the strange thing is how far the stock was able to rise during that particular nine-week run, especially since the long-term money flow (based on the 100-period Chaikin money flow histogram [CMF][100]) remained in negative territory the entire time. See Figures 1 and 2. |

|
| FIGURE 1: DARDEN, DAILY. DRI's daily chart breakout looks fine at first glance, but note how persistently weak that long-term money flow has been for nearly four months now. |
| Graphic provided by: MetaStock. |
| Graphic provided by: CS Scientific expert from MetaStock 11. |
| |
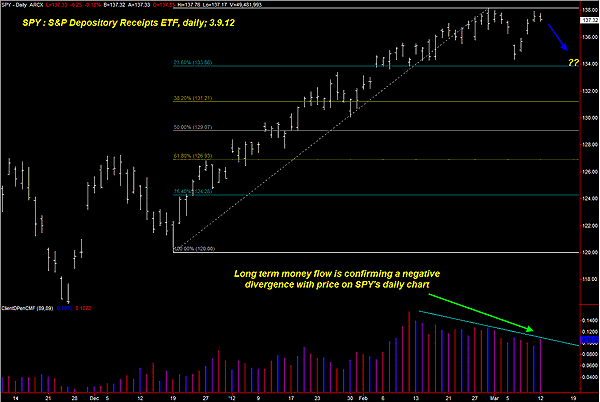
| Now, with the stock trying to make a follow-through attempt after its March 8, 2012, breakout, the money flow situation is still anemic, leading to the conclusion that any break higher in the stock will likely soon fail unless the money flow in this consumer discretionary sector stock begins to improve -- and soon. DRI does have above-average relative strength versus the Standard & Poor's 500 (.SPX), and it also pays a respectable dividend of 3.3%, which perhaps offers the stock a bit of plunge protection in case the .SPX continues on its merry rundown to an expected major April or May cycle low. The .SPX has reasonably strong support near 1342, but if the anticipated cycles play out, once we see that price level violated, then a strong thrust lower toward 1310 or even 1290 by late April isn't out of the question. These are a few things that every trader needs to be aware of as we head into springtime, regardless if you're a bull or a bear. Market optimism is also rampant, with one analyst commenting that he expected to see a "melt-up" in large-cap stock prices over the next month or two, even as some major sentiment indexes are also getting near the logical limits of their extreme bullish optimism parameters. While no one can say for sure how any market plays out in the near term, it is always a good idea to play it safe, no matter what kind of trader you are. Here are a few ideas that might help you limit losses and/or help keep you out of harm's way altogether, just in case we are about to witness a "tornado outbreak" in the broad market indexes: 1. Diversify among many market groups, with a slightly heavier weighting on strong relative strength groups (four-week or 13-week relative strength versus the .SPX) 2. Make sure you have included many low bets (less volatile than the .SPX as a whole), high-dividend-yield large caps within your diversified portfolio 3. Have a way to find the kind of stocks mentioned in ideas 1 and 2; the cash-rich scan in TradeStation could give you plenty of stocks that you can do further analysis on 4. Use a market timing filter. For example, when the CS Scientific Hybrid Trade screen in MetaStock 11 is painting the price bars in the .SPX in red and/or its yellow expert advisor ribbon suggests that going short is the likely trading course of action. You may want to just pull the plug on everything and just stay in cash until market situations improve. Ultimately, you'll need to develop your own strategy, but those are a few ideas that might help your portfolio weather any upcoming turbulence in the broad US markets. |

|
| FIGURE 2: SPY ETF, DAILY. The bounce after the recent mini selloff may very well be a failure swing, one that initiates the slide lower into an April or May 2012 major cycle low. Note the deteriorating long-term money flow on this daily chart of SPY. |
| Graphic provided by: TradeStation. |
| |
Donald W. Pendergast is a financial markets consultant who offers specialized services to stock brokers and high net worth individuals who seek a better bottom line for their portfolios.
| Title: | Writer, market consultant |
| Company: | Linear Trading Systems LLC |
| Jacksonville, FL 32217 | |
| Phone # for sales: | 904-239-9564 |
| E-mail address: | lineartradingsys@gmail.com |
Traders' Resource Links | |
| Linear Trading Systems LLC has not added any product or service information to TRADERS' RESOURCE. | |
Click here for more information about our publications!
PRINT THIS ARTICLE

Request Information From Our Sponsors
- StockCharts.com, Inc.
- Candle Patterns
- Candlestick Charting Explained
- Intermarket Technical Analysis
- John Murphy on Chart Analysis
- John Murphy's Chart Pattern Recognition
- John Murphy's Market Message
- MurphyExplainsMarketAnalysis-Intermarket Analysis
- MurphyExplainsMarketAnalysis-Visual Analysis
- StockCharts.com
- Technical Analysis of the Financial Markets
- The Visual Investor
- VectorVest, Inc.
- Executive Premier Workshop
- One-Day Options Course
- OptionsPro
- Retirement Income Workshop
- Sure-Fire Trading Systems (VectorVest, Inc.)
- Trading as a Business Workshop
- VectorVest 7 EOD
- VectorVest 7 RealTime/IntraDay
- VectorVest AutoTester
- VectorVest Educational Services
- VectorVest OnLine
- VectorVest Options Analyzer
- VectorVest ProGraphics v6.0
- VectorVest ProTrader 7
- VectorVest RealTime Derby Tool
- VectorVest Simulator
- VectorVest Variator
- VectorVest Watchdog
