HOT TOPICS LIST
- MACD
- Fibonacci
- RSI
- Gann
- ADXR
- Stochastics
- Volume
- Triangles
- Futures
- Cycles
- Volatility
- ZIGZAG
- MESA
- Retracement
- Aroon
INDICATORS LIST
LIST OF TOPICS
PRINT THIS ARTICLE
by Koos van der Merwe
Looking to buy & hold? Here are two stocks you may be interested in.
Position: Accumulate
Koos van der Merwe
Has been a technical analyst since 1969, and has worked as a futures and options trader with First Financial Futures in Johannesburg, South Africa.
PRINT THIS ARTICLE
MOVING AVERAGES
Looking For Buy & Hold
03/16/12 08:54:25 AMby Koos van der Merwe
Looking to buy & hold? Here are two stocks you may be interested in.
Position: Accumulate
| By building a portfolio of good dividend-paying companies with a history of increasing dividends, you can sleep better at night in these volatile times. Reduce risk by investing in dividend-paying companies that have been around for decades. I have always avoided investing in a stock that pays a dividend of less than 7%. These days, however, considering today's volatile market, which tends to have a sharp reaction when any European country, especially Greece, sneezes, protecting your assets is a primary concern, and a dividend of 4% would be acceptable. Two stocks worth looking at are Exchange Income Corp. and Sun Life Financial. Of course, there are many others that pay equally well, if not better, but look at these two for starters. |

|
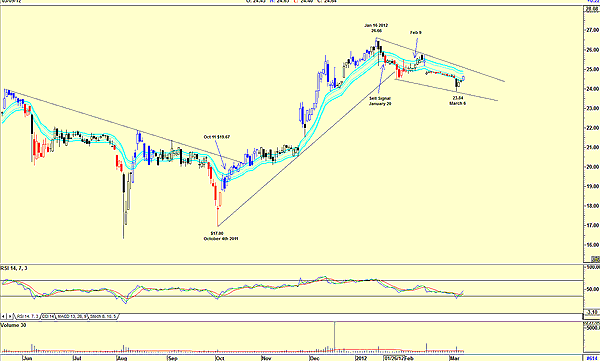
| FIGURE 1: EXCHANGE INCOME CORP. |
| Graphic provided by: AdvancedGET. |
| |
| Exchange Income Corp. At the moment, this fund, listed on the Toronto Stock Exchange, is paying a dividend yielding 6.3% as at Friday, March 9, 2012. Figure 1 shows how the price reached a low of $17 on October 4, 2011. It gave a JM internal band buy signal at $19.67 on October 11, when it broke above the upper band. The JM internal band that I have used here is a 15-period exponential moving average (EMA) offset by 2% positive and 2% negative. I use the JM internal band as a very conservative buy/sell indicator. The price then rose to a high of $26.66 by January 16, 2012, before correcting to a low of $23.84 by March 6. Note the sell signal given on January 20, when the price broke below the lower band, a signal confirmed by the relative strength index (RSI) at overbought levels. On February 9, a new buy signal was given as the price broke above the upper band, but this buy signal was not confirmed by the RSI, which was still trending downward. |

|
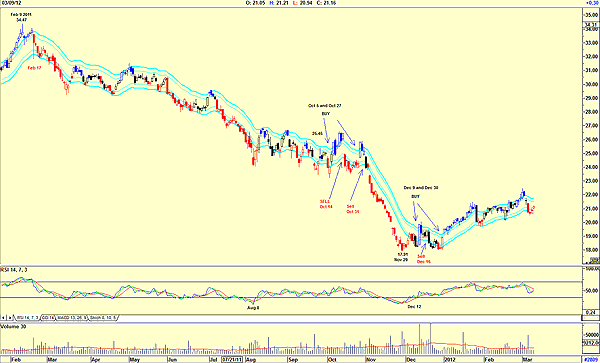
| FIGURE 2: SUN LIFE FINANCIAL |
| Graphic provided by: AdvancedGET. |
| |
| Sun Life Financial The share price of Sun Life Financial reached a high of $34.47 on February 9, 2011, and then fell, testing the JM internal band sell line and breaking through it. The RSI gave a sell signal on February 17. The share price gave a buy signal on October 5 and again on October 27 at around the $25.45 level, but very soon gave a JM internal band sell signal on October 14 and October 31, even though the RSI was moving sideways after having given a buy signal on August 8. See Figure 2. On December 9, the price broke above the JM internal band, suggesting a buy, but this was not confirmed by the RSI, which only gave a buy signal on December 12. On December 30, the price broke above the upper JM band on a gap, and with the RSI drifting up, we would have bought, and held. The yield offered at the present price is 6.8%. With prices as low as they are, and knowing that the company is sound, the share is worth purchasing for a long-term buy & hold. There are many companies out there that offer yields as good as, if not better than, the two mentioned here, but both companies have had their downfall and are in recovery mode. They are definitely worth considering for a buy & hold. |
Has been a technical analyst since 1969, and has worked as a futures and options trader with First Financial Futures in Johannesburg, South Africa.
| Address: | 3256 West 24th Ave |
| Vancouver, BC | |
| Phone # for sales: | 6042634214 |
| E-mail address: | petroosp@gmail.com |
Click here for more information about our publications!
PRINT THIS ARTICLE

Request Information From Our Sponsors
- StockCharts.com, Inc.
- Candle Patterns
- Candlestick Charting Explained
- Intermarket Technical Analysis
- John Murphy on Chart Analysis
- John Murphy's Chart Pattern Recognition
- John Murphy's Market Message
- MurphyExplainsMarketAnalysis-Intermarket Analysis
- MurphyExplainsMarketAnalysis-Visual Analysis
- StockCharts.com
- Technical Analysis of the Financial Markets
- The Visual Investor
- VectorVest, Inc.
- Executive Premier Workshop
- One-Day Options Course
- OptionsPro
- Retirement Income Workshop
- Sure-Fire Trading Systems (VectorVest, Inc.)
- Trading as a Business Workshop
- VectorVest 7 EOD
- VectorVest 7 RealTime/IntraDay
- VectorVest AutoTester
- VectorVest Educational Services
- VectorVest OnLine
- VectorVest Options Analyzer
- VectorVest ProGraphics v6.0
- VectorVest ProTrader 7
- VectorVest RealTime Derby Tool
- VectorVest Simulator
- VectorVest Variator
- VectorVest Watchdog
