HOT TOPICS LIST
- MACD
- Fibonacci
- RSI
- Gann
- ADXR
- Stochastics
- Volume
- Triangles
- Futures
- Cycles
- Volatility
- ZIGZAG
- MESA
- Retracement
- Aroon
INDICATORS LIST
LIST OF TOPICS
PRINT THIS ARTICLE
by Gary Grosschadl
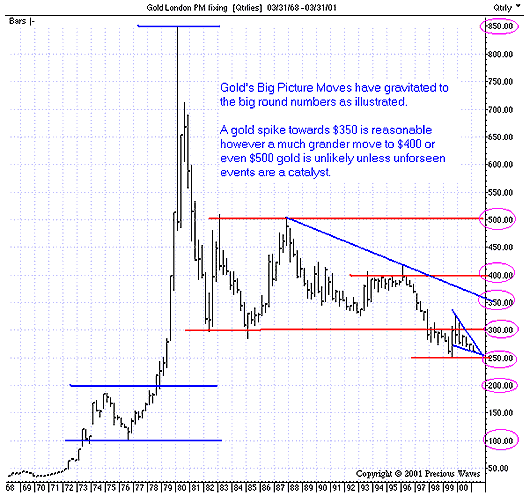
After drawing some trendlines on a long-term chart for gold, it's striking to see how gold gravitates to the big round numbers.
Position: N/A
Gary Grosschadl
Independent Canadian equities trader and technical analyst based in Peterborough
Ontario, Canada.
PRINT THIS ARTICLE
GOLD & METALS
Gold Moves to the Big Round Numbers
05/31/02 09:12:07 AMby Gary Grosschadl
After drawing some trendlines on a long-term chart for gold, it's striking to see how gold gravitates to the big round numbers.
Position: N/A
| This compelling chart spanning 30 years shows gold's infamous spike to $850 and then a long and wide trading range, from $300 - $500. When gold eventually went under the $300 support, note that it ended at $250. If this chart were updated, we would see that the falling wedge pattern was indeed bullish, and longer-term traders who bought at the breakout of the wedge were amply rewarded at a rich move that ended well past the $300 congestion zone. |
| As gold sits around the $325 level, traders are wondering about $330. If you believe the implications of this chart, then a brief spike to $350 or close to it could well be in store as gold satisfies another move to the big round numbers. |

|
| |
| Since all markets are reversal oriented (we have been painfully reminded of this since the high tech meltdown), what might happen after gold's next big upthrust ? The downside scenario may be a substantial reversal to $250 or even $200. Since gold often moves in opposite directions to the main equity indices, we have an argument for the upwards spike to coincide with a bottoming of the Dow and Nasdaq. Likewise, once the next big rally eventually occurs, this move will punish gold prices as traders abandon this "safe haven" to once again chase the main indices onwards and upwards. This punishing or corrective phase for gold is the likely vehicle for yet another gold move to the big round numbers. |
Independent Canadian equities trader and technical analyst based in Peterborough
Ontario, Canada.
| Website: | www.whatsonsale.ca/financial.html |
| E-mail address: | gwg7@sympatico.ca |
Click here for more information about our publications!
Comments
Date: 06/04/02Rank: 4Comment:
Date: 06/11/02Rank: 5Comment:
Date: 06/18/02Rank: 5Comment: thanks for the insight

Request Information From Our Sponsors
- StockCharts.com, Inc.
- Candle Patterns
- Candlestick Charting Explained
- Intermarket Technical Analysis
- John Murphy on Chart Analysis
- John Murphy's Chart Pattern Recognition
- John Murphy's Market Message
- MurphyExplainsMarketAnalysis-Intermarket Analysis
- MurphyExplainsMarketAnalysis-Visual Analysis
- StockCharts.com
- Technical Analysis of the Financial Markets
- The Visual Investor
- VectorVest, Inc.
- Executive Premier Workshop
- One-Day Options Course
- OptionsPro
- Retirement Income Workshop
- Sure-Fire Trading Systems (VectorVest, Inc.)
- Trading as a Business Workshop
- VectorVest 7 EOD
- VectorVest 7 RealTime/IntraDay
- VectorVest AutoTester
- VectorVest Educational Services
- VectorVest OnLine
- VectorVest Options Analyzer
- VectorVest ProGraphics v6.0
- VectorVest ProTrader 7
- VectorVest RealTime Derby Tool
- VectorVest Simulator
- VectorVest Variator
- VectorVest Watchdog
