HOT TOPICS LIST
- MACD
- Fibonacci
- RSI
- Gann
- ADXR
- Stochastics
- Volume
- Triangles
- Futures
- Cycles
- Volatility
- ZIGZAG
- MESA
- Retracement
- Aroon
INDICATORS LIST
LIST OF TOPICS
PRINT THIS ARTICLE
by Billy Williams
The trend is your friend, but navigating the turns in the market can help you make larger returns by catching tops and bottoms at just the right moment.
Position: Buy
Billy Williams
Billy Williams has been trading the markets for 27 years, specializing in momentum trading with stocks and options.
PRINT THIS ARTICLE
STRATEGIES
How To Play The Turns In The Market
03/14/12 01:52:25 PMby Billy Williams
The trend is your friend, but navigating the turns in the market can help you make larger returns by catching tops and bottoms at just the right moment.
Position: Buy
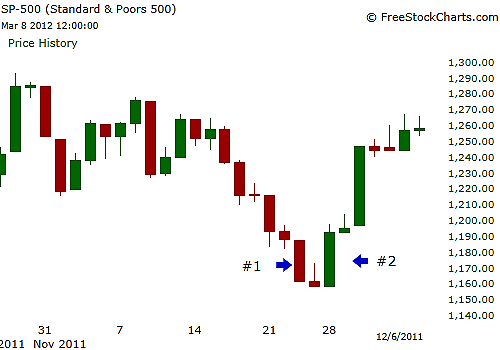
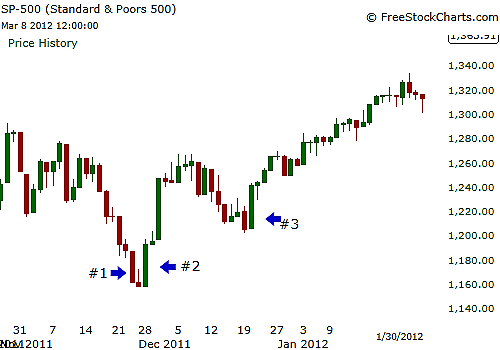
| Paul Tudor Jones, the billionaire hedge fund manager who was profiled in Jack Schwager's "The Market Wizards," has been quoted as saying: "I believe the very best money is made at the market turns. Everyone says you get killed trying to pick tops and bottoms and you make all your money by playing the trend in the middle. Well, for 12 years I have been missing the meat in the middle, but I have made a lot of money at tops and bottoms." One of Jones's most notable successes was profiting from Black Monday in 1987, where he pummeled the market through holding massive short positions where he reportedly made an estimated $100 million that year. While two of the most common trading maxims are "Trade the trend" or "The trend is your friend," there is much to be learned from Jones's comments and looking for the top and bottom in a trend where price reaches an inflection point where it could reverse and where potential fortunes await for those with the skill and will to find them. These inflection points, where price reaches a high degree of instability and finds itself at a tipping point where it just doesn't swing back in the other direction but explodes in the opposite direction with explosive ferocity, are where you can find not just a new trend emerging but enormous profit potential that can turn an average trade into a trade of breathtaking gains. See Figures 1 and 2. |

|
| FIGURE 1: S&P 500. At point 1, the SPX formed a strong bearish price bar that opened and closed within the upper and lower part of its price range. At point 2, a couple of days later, a bullish price bar formed that opened and closed at the upper and lower portions of its own price range while retracing more than 55% of the bearish price bar's range, signaling that a bottom had formed and a trend reversal. |
| Graphic provided by: www.freestockcharts.com. |
| |
| However, navigating turns can be tricky but combining a degree of trend-trading along with the ability to catch the turns in an established trend can help you mitigate your risk while having the added benefit of maximizing your return. When an established trend is in place, you can observe a natural ebb and flow to the progression of its price movement where price rises and falls in a steady stair-step approach. When price pulls back is where the opportunity to call the bottom in a bullish trend or call a top in a bearish trend gives you the opportunity to enter as price begins the move back in the direction of its dominant trend. |

|
| FIGURE 2: S&P 500. Weeks later, at point 3, a strong price formed that engulfed the previous trading day's price range signaled another bottom, where price resumed its trend higher. |
| Graphic provided by: www.freestockcharts.com. |
| |
| While there are number of techniques for pullback trading, you want to focus on the price bar itself during this time of transition. Specifically, you want to look for a price bar that exhibits strength in the direction of the bullish trend by opening within 25% of its intraday low for the day and closing within the upper 25% range of its intraday high. Conversely, you want a bearish price bar to open within 25% of its intraday high and close within the 25% range of its intraday low. In a bullish trend, when price pulls back with the type of strength detailed in the previous paragraph, you want to observe when price retraces 55% of that bar's range and when the preceding price bar forms in the same fashion back in the direction of the dominant bullish trend, signaling that a bottom has formed and the market is turning upward again. |
| In a bearish trend, watch for price to pull back and form the same type of price bar just described in an upward move, watching for price to retrace 55% of that price bar's move. This shows a top being established where price reverses the pullback and trades back in the direction of the dominant bearish trend. |
| Using price bars this way will help you spot where turns are forming in price action and let you enter just as the move is gathering momentum back in its dominant direction, helping you time your entries with greater precision and reducing your risk as a result. |
Billy Williams has been trading the markets for 27 years, specializing in momentum trading with stocks and options.
| Company: | StockOptionSystem.com |
| E-mail address: | stockoptionsystem.com@gmail.com |
Traders' Resource Links | |
| StockOptionSystem.com has not added any product or service information to TRADERS' RESOURCE. | |
Click here for more information about our publications!
PRINT THIS ARTICLE

|

Request Information From Our Sponsors
- StockCharts.com, Inc.
- Candle Patterns
- Candlestick Charting Explained
- Intermarket Technical Analysis
- John Murphy on Chart Analysis
- John Murphy's Chart Pattern Recognition
- John Murphy's Market Message
- MurphyExplainsMarketAnalysis-Intermarket Analysis
- MurphyExplainsMarketAnalysis-Visual Analysis
- StockCharts.com
- Technical Analysis of the Financial Markets
- The Visual Investor
- VectorVest, Inc.
- Executive Premier Workshop
- One-Day Options Course
- OptionsPro
- Retirement Income Workshop
- Sure-Fire Trading Systems (VectorVest, Inc.)
- Trading as a Business Workshop
- VectorVest 7 EOD
- VectorVest 7 RealTime/IntraDay
- VectorVest AutoTester
- VectorVest Educational Services
- VectorVest OnLine
- VectorVest Options Analyzer
- VectorVest ProGraphics v6.0
- VectorVest ProTrader 7
- VectorVest RealTime Derby Tool
- VectorVest Simulator
- VectorVest Variator
- VectorVest Watchdog
