HOT TOPICS LIST
- MACD
- Fibonacci
- RSI
- Gann
- ADXR
- Stochastics
- Volume
- Triangles
- Futures
- Cycles
- Volatility
- ZIGZAG
- MESA
- Retracement
- Aroon
INDICATORS LIST
LIST OF TOPICS
PRINT THIS ARTICLE
by Donald W. Pendergast, Jr.
After such a big run higher, it's not surprising that the .SPX is due for a breather. Just how big a decline awaits may be determined by its strongest support levels.
Position: N/A
Donald W. Pendergast, Jr.
Donald W. Pendergast is a financial markets consultant who offers specialized services to stock brokers and high net worth individuals who seek a better bottom line for their portfolios.
PRINT THIS ARTICLE
SUPPORT & RESISTANCE
S&P 500 Support Levels To Watch
03/14/12 08:16:46 AMby Donald W. Pendergast, Jr.
After such a big run higher, it's not surprising that the .SPX is due for a breather. Just how big a decline awaits may be determined by its strongest support levels.
Position: N/A
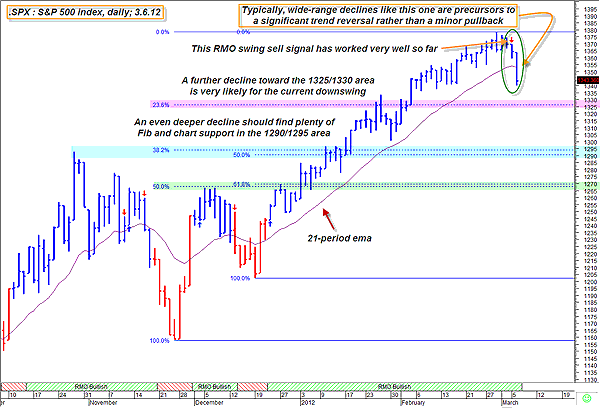
| After making a 300-plus point rally in only five months, the Standard & Poor's 500 (.SPX) appears to be in the early stages of a significant trend reversal, but it has plenty of support levels that may help slow its rate of descent. Here's a closer look at the daily chart for the .SPX (Figure 1). |

|
| FIGURE 1: SPX, DAILY. Typically, in a trend reversal, the Fibonacci 23.6% support level is one of the first casualties to be seen as the downtrend strengthens. |
| Graphic provided by: MetaStock. |
| Graphic provided by: RMO indicators from MetaStock 11. |
| |
| This chart is a wonderful teaching tool for newer traders who might be wondering how to discern the difference between a normal pullback and a trend reversal; see how during the major December to March upswing that the pullbacks were always well contained by the 21-period exponential moving average (EMA) and that the daily range of the price bars during such incidents weren't much larger than normal. Just recently, however, the .SPX has smashed right through that same 21-period EMA with the largest bearish daily range price bar seen since early December 2011. Typically, price action like this occurs at the onset of a trend reversal rather than as some sort of temporary pullback before another leg higher in the existing uptrend. Assuming that this is a trend reversal, the most likely place to look for a temporary pause to the selling may be at the Fibonacci 23.6% retracement somewhere near 1325.00. Prices did rally a little on Wednesday, but the Fibonacci 23.6% level will usually draw price like a magnet once a real reversal gets under way, after which that level usually gives way and results in another leg down toward the next set of Fibonacci supports, in this case, the area near the 1290/1295 price range. This is a major support area (blue shaded area on chart), where two distinct Fibonacci ratios from different degree swings converge along with a major price point on the chart -- the October 2011 high at 1292.66. Finally, there is yet another strong Fibonacci confluence/chart support point near 1270 -- see the green shaded area. Bottom line? Look for the upper Fibonacci retracement to give way within the next few trading sessions, with the 1320/1325 area to offer the first area of major support for this developing trend reversal. |

|
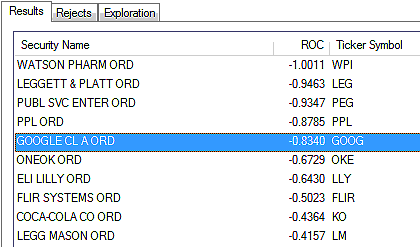
| FIGURE 2: RELATIVE STRENGTH. Here are the weakest relative strength large-cap stocks versus the .SPX, which are also firing RMO swing sell signals. |
| Graphic provided by: MetaStock. |
| Graphic provided by: MetaStock Explorer. |
| |
| Assuming that Wednesday's relief rally was just a fakeout before another selloff, one of the smartest things a trader can do is search out weak relative strength (vs. the .SPX) large-cap stocks that are issuing sell signals. You can see in Figure 2 that a variety of stocks are firing Rahul Mohindar (RMO) swing sell signals, and that there is no shortage of opportunity should the selloff resume on Thursday. Many of these stocks have excellent options liquidity, and skilled traders should have little trouble constructing viable trading strategies with them. Just make sure you use modest position sizing and wise trade management techniques, no matter how you choose to play this budding reversal in the .SPX. |
Donald W. Pendergast is a financial markets consultant who offers specialized services to stock brokers and high net worth individuals who seek a better bottom line for their portfolios.
| Title: | Writer, market consultant |
| Company: | Linear Trading Systems LLC |
| Jacksonville, FL 32217 | |
| Phone # for sales: | 904-239-9564 |
| E-mail address: | lineartradingsys@gmail.com |
Traders' Resource Links | |
| Linear Trading Systems LLC has not added any product or service information to TRADERS' RESOURCE. | |
Click here for more information about our publications!
PRINT THIS ARTICLE

Request Information From Our Sponsors
- StockCharts.com, Inc.
- Candle Patterns
- Candlestick Charting Explained
- Intermarket Technical Analysis
- John Murphy on Chart Analysis
- John Murphy's Chart Pattern Recognition
- John Murphy's Market Message
- MurphyExplainsMarketAnalysis-Intermarket Analysis
- MurphyExplainsMarketAnalysis-Visual Analysis
- StockCharts.com
- Technical Analysis of the Financial Markets
- The Visual Investor
- VectorVest, Inc.
- Executive Premier Workshop
- One-Day Options Course
- OptionsPro
- Retirement Income Workshop
- Sure-Fire Trading Systems (VectorVest, Inc.)
- Trading as a Business Workshop
- VectorVest 7 EOD
- VectorVest 7 RealTime/IntraDay
- VectorVest AutoTester
- VectorVest Educational Services
- VectorVest OnLine
- VectorVest Options Analyzer
- VectorVest ProGraphics v6.0
- VectorVest ProTrader 7
- VectorVest RealTime Derby Tool
- VectorVest Simulator
- VectorVest Variator
- VectorVest Watchdog
