HOT TOPICS LIST
- MACD
- Fibonacci
- RSI
- Gann
- ADXR
- Stochastics
- Volume
- Triangles
- Futures
- Cycles
- Volatility
- ZIGZAG
- MESA
- Retracement
- Aroon
INDICATORS LIST
LIST OF TOPICS
PRINT THIS ARTICLE
by Donald W. Pendergast, Jr.
Contrary to what many hard-money devotees may believe, the US dollar may not be all washed up after all.
Position: N/A
Donald W. Pendergast, Jr.
Donald W. Pendergast is a financial markets consultant who offers specialized services to stock brokers and high net worth individuals who seek a better bottom line for their portfolios.
PRINT THIS ARTICLE
.DXY Ready For A Swing Up?
03/13/12 08:27:10 AMby Donald W. Pendergast, Jr.
Contrary to what many hard-money devotees may believe, the US dollar may not be all washed up after all.
Position: N/A
| The US Dollar Index (a weighted index of six major global currencies versus the US dollar) had a rough time over the past 10-plus years, dropping all the way from 121.02 in July 2001 down to 70.70 in March 2008. During that worst phase of the dollar bear market, the price of gold and silver increased in price by a substantial amount, causing even mainstream financial commentators to consider the negative economic and social consequences if the decline wasn't halted or at least slowed down. Here we are, four years later, sifting through (and hopefully finally emerging from) the worst global economic crackup since the 1930s, and the US Dollar Index (.DXY) is sitting at 79.30, with its current price reading nestled in the midst of a nearly four-year-old, wide range consolidation pattern -- this, after the price of gold went to nearly $2,000 and silver almost hit $50 last spring. Is this disconnection between the .DXY and the price of precious metals (and other dollar-denominated commodities) an early warning signal that the .DXY may be ready to stage yet another move higher in an attempt to recoup even more of the horrendous losses it endured through most of the last decade? No one really knows, but one thing is sure: the Rahul Mohindar (RMO) trading system in MetaStock 11 has just issued a swing buy signal on .DXY's daily chart, and the setup looks convincing. Here's a closer look in Figures 1 and 2. |

|
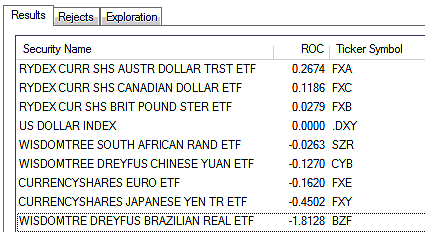
| FIGURE 1: CURRENCY EXCHANGE TRADED FUNDS RELATIVE STRENGTH. A mix of currency exchange traded funds, ranked in terms of their 13-week relative strength vs. the US Dollar Index. |
| Graphic provided by: MetaStock. |
| Graphic provided by: MetaStock Explorer. |
| |
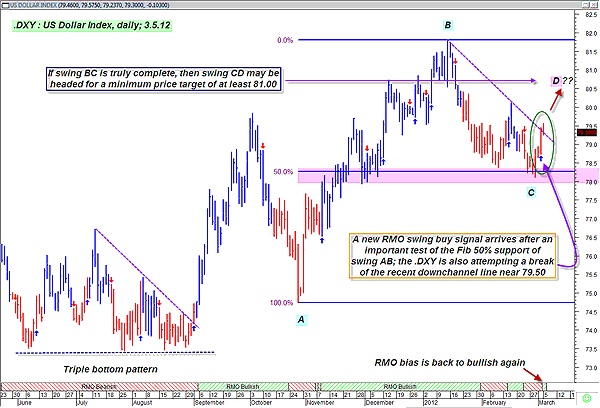
| After making a sharp bullish run higher that confirmed last summer's triple-bottom pattern was indeed a go, the .DXY made up for some of its previous losses, and in a hurry, as the dramatic performance of swing AB clearly testifies. After making a nonviolent, proportional retracement of 50% of swing AB (with heavy chart support in the lower 78.00 range), the .DXY is once again starting to flex its muscles, firing a new long RMO swing buy signal even as it attempts to break out of the down channel (purple dashed resistance line) forged by swing BC. Relying on a simple swing price target formula, we can arrive at some idea of a logical price target for emerging swing CD, as follows: Swing AB = 7.54 points Swing BC = 3.689 points 7.54 minus 3.689 = 3.851 points Going further, let's take 61.8% of 3.851, which equals 2.38. Now, we simply add 2.38 points to the value of point C and come up our handy-dandy price target value as follows: 78.095 plus 2.38 = 80.475 A bare minimum logical price target is near 80.475, assuming that swing BC is already a done deal and the .DXY has enough buying pressure beneath it to reach a bit higher. So how to play this bit of technical information? If you trade futures, why not consider selling a near-term put option with a strike price of around 77.00, taking advantage of the strong support level near 78.00 as your primary line of position defense? Or perhaps you can just use an exchange traded fund (ETF) like UUP to captalize on this potentially bullish swing setup, relying on a two- to three-bar trailing stop of the daily lows as your main trade management tool. You could also look to go short the euro even as you go long the US Dollar Index, since the euro has the heaviest weighting in the .DXY. The possibilities are many, only limited by the size of your trading account and trading skill level. Just make sure you use strict position sizing and risk control to make sure that your potential for large losses is kept under control. |

|
| FIGURE 2: DXY, DAILY. At times, the .DXY can make nice, tradable swings on its daily time frame. If the swing BC is complete, then there is a good chance that swing CD may reach close to 80.50 at a minimum. |
| Graphic provided by: MetaStock. |
| Graphic provided by: RMO trading system indicators from MetaStock 11. |
| |
Donald W. Pendergast is a financial markets consultant who offers specialized services to stock brokers and high net worth individuals who seek a better bottom line for their portfolios.
| Title: | Writer, market consultant |
| Company: | Linear Trading Systems LLC |
| Jacksonville, FL 32217 | |
| Phone # for sales: | 904-239-9564 |
| E-mail address: | lineartradingsys@gmail.com |
Traders' Resource Links | |
| Linear Trading Systems LLC has not added any product or service information to TRADERS' RESOURCE. | |
Click here for more information about our publications!
Comments

Request Information From Our Sponsors
- VectorVest, Inc.
- Executive Premier Workshop
- One-Day Options Course
- OptionsPro
- Retirement Income Workshop
- Sure-Fire Trading Systems (VectorVest, Inc.)
- Trading as a Business Workshop
- VectorVest 7 EOD
- VectorVest 7 RealTime/IntraDay
- VectorVest AutoTester
- VectorVest Educational Services
- VectorVest OnLine
- VectorVest Options Analyzer
- VectorVest ProGraphics v6.0
- VectorVest ProTrader 7
- VectorVest RealTime Derby Tool
- VectorVest Simulator
- VectorVest Variator
- VectorVest Watchdog
- StockCharts.com, Inc.
- Candle Patterns
- Candlestick Charting Explained
- Intermarket Technical Analysis
- John Murphy on Chart Analysis
- John Murphy's Chart Pattern Recognition
- John Murphy's Market Message
- MurphyExplainsMarketAnalysis-Intermarket Analysis
- MurphyExplainsMarketAnalysis-Visual Analysis
- StockCharts.com
- Technical Analysis of the Financial Markets
- The Visual Investor
