HOT TOPICS LIST
- MACD
- Fibonacci
- RSI
- Gann
- ADXR
- Stochastics
- Volume
- Triangles
- Futures
- Cycles
- Volatility
- ZIGZAG
- MESA
- Retracement
- Aroon
INDICATORS LIST
LIST OF TOPICS
PRINT THIS ARTICLE
by Koos van der Merwe
Analyzing the S&P 500 using a Gann square.
Position: Sell
Koos van der Merwe
Has been a technical analyst since 1969, and has worked as a futures and options trader with First Financial Futures in Johannesburg, South Africa.
PRINT THIS ARTICLE
GANN
A Look At S&P 500 Using Gann
03/09/12 08:50:11 AMby Koos van der Merwe
Analyzing the S&P 500 using a Gann square.
Position: Sell
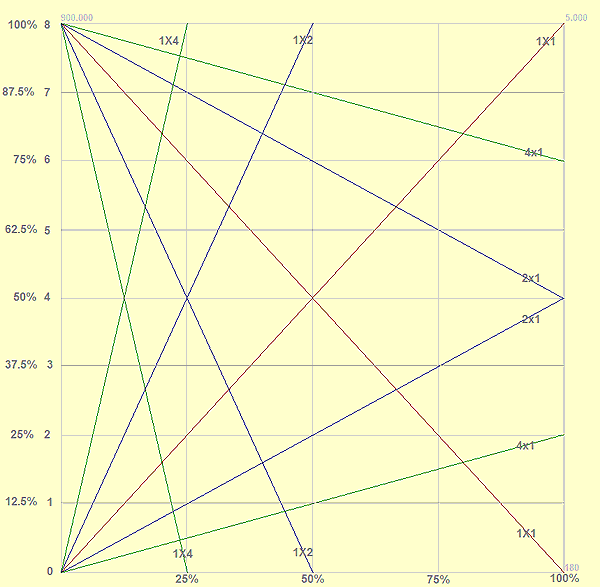
| The Gann square is very well known. Gann would also divide a square into eight support and resistance levels, as shown in Figure 1. |

|
| FIGURE 1: GANN SQUARE |
| Graphic provided by: AdvancedGET. |
| |
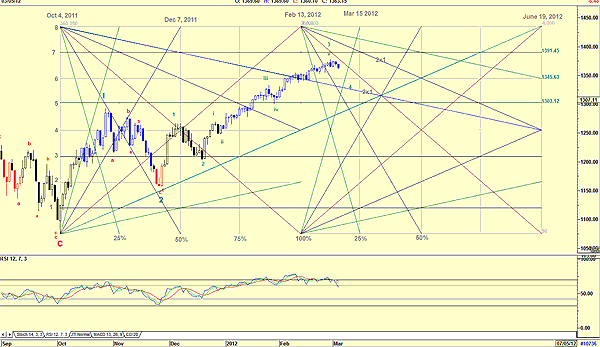
| Note how the height of the square in Figure 1 is divided into eight parts, and the width into four parts. The height gives us possible support and resistance levels, and the width gives us future dates that turning points could occur. Apply this Gann fan to the daily chart of the Standard & Poor's 500 gives us Figure 2. |

|
| FIGURE 2: GANN SQUARE APPLIED TO THE S&P 500 |
| Graphic provided by: AdvancedGET. |
| |
| We can see how the index rose strongly from the low of October 4, 2011, along the 1 x 4 angle with a correction when it hit #2, the 25% height line. The index then continued upward to #3, the 37.5% height line. At this level, the index broke below the 1 x 4 angle and started following the 1 x 2 angle. At the #4 height line, the 50% level, it paused once again with a correction. It then continued upward, but found resistance at the 1 x 2 down angle, falling to the #3 height line, retracing to the #4 height line, and then fell to find support on the #2 height line after the 1 x 2 angle down. The price then rose to the 50% (#4) height line, which is also the 50% time line, a position where the 1 x 1 angle up and down cross. This occurred on December 7, 2011. From this level, the price then dropped to find support at the #3 height level. From this level, it rose, finding resistance and support at various height levels as shown. Note how the index tracked the #6 height level for six days before rising. What does the future hold? The Elliott wave count shown is looking for a fourth-wave correction of wave 3. This is confirmed by the relative strength index (RSI), which has given a sell signal. The Gann chart is suggesting that the index should fall to test the #6 height line at the 1345.63 level. Should it break below this level, which appears likely because of the Elliott wave rule, a wave 4 correction falls to the fourth wave of lesser degree; it could fall to find support on the 2x1 angle shown on the chart. The time to watch for the correction to bottom is March 15. Gann angles, height lines, and time lines in a Gann square do give us an idea of what can be expected for the future. We know that a correction is on the cards, we also have an approximate idea of support and resistance lines as the index falls, and the time we can expect the correction to reverse. |
Has been a technical analyst since 1969, and has worked as a futures and options trader with First Financial Futures in Johannesburg, South Africa.
| Address: | 3256 West 24th Ave |
| Vancouver, BC | |
| Phone # for sales: | 6042634214 |
| E-mail address: | petroosp@gmail.com |
Click here for more information about our publications!
Comments
Date: 03/13/12Rank: Comment: Koos,
I look forward to your follow-up to this analysis.
Dick Slayton

Request Information From Our Sponsors
- StockCharts.com, Inc.
- Candle Patterns
- Candlestick Charting Explained
- Intermarket Technical Analysis
- John Murphy on Chart Analysis
- John Murphy's Chart Pattern Recognition
- John Murphy's Market Message
- MurphyExplainsMarketAnalysis-Intermarket Analysis
- MurphyExplainsMarketAnalysis-Visual Analysis
- StockCharts.com
- Technical Analysis of the Financial Markets
- The Visual Investor
- VectorVest, Inc.
- Executive Premier Workshop
- One-Day Options Course
- OptionsPro
- Retirement Income Workshop
- Sure-Fire Trading Systems (VectorVest, Inc.)
- Trading as a Business Workshop
- VectorVest 7 EOD
- VectorVest 7 RealTime/IntraDay
- VectorVest AutoTester
- VectorVest Educational Services
- VectorVest OnLine
- VectorVest Options Analyzer
- VectorVest ProGraphics v6.0
- VectorVest ProTrader 7
- VectorVest RealTime Derby Tool
- VectorVest Simulator
- VectorVest Variator
- VectorVest Watchdog
