HOT TOPICS LIST
- MACD
- Fibonacci
- RSI
- Gann
- ADXR
- Stochastics
- Volume
- Triangles
- Futures
- Cycles
- Volatility
- ZIGZAG
- MESA
- Retracement
- Aroon
INDICATORS LIST
LIST OF TOPICS
PRINT THIS ARTICLE
by Donald W. Pendergast, Jr.
Shares of Baker Hughes recently staged a bullish breakout from a large triangle pattern and now appear to be at a critical make-or-break point.
Position: N/A
Donald W. Pendergast, Jr.
Donald W. Pendergast is a financial markets consultant who offers specialized services to stock brokers and high net worth individuals who seek a better bottom line for their portfolios.
PRINT THIS ARTICLE
For Baker Hughes, Was The Breakout A Bust?
03/08/12 09:05:57 AMby Donald W. Pendergast, Jr.
Shares of Baker Hughes recently staged a bullish breakout from a large triangle pattern and now appear to be at a critical make-or-break point.
Position: N/A
| Whenever a stock or commodity breaks higher from a very large and well-defined chart pattern, you can be sure that many traders and investors will be ready to pounce on the move -- bullish or bearish -- hoping to capitalize on more follow-through in the direction of such price surges. Shares of Baker Hughes (BHI) finally did break higher out of a large multimonth triangle pattern recently, but they have now actually dropped back into the pattern, suggesting that the move may have been premature and/or has actually failed. To add more validity to the case for a failed breakout, one of the better trading systems in MetaStock 11 has actually issued a new sell signal for BHI on its daily chart. Here's a closer look right now in Figures 1 and 2. |

|
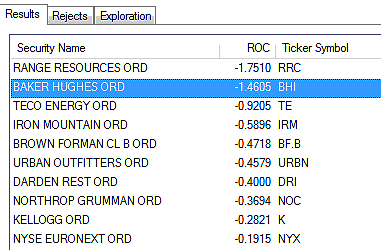
| FIGURE 1: RELATIVE STRENGTH. The large-cap stocks issuing RMO swing sell signals that are also underperforming the .SPX over the last 13 weeks. |
| Graphic provided by: MetaStock. |
| Graphic provided by: MetaStock Explorer. |
| |
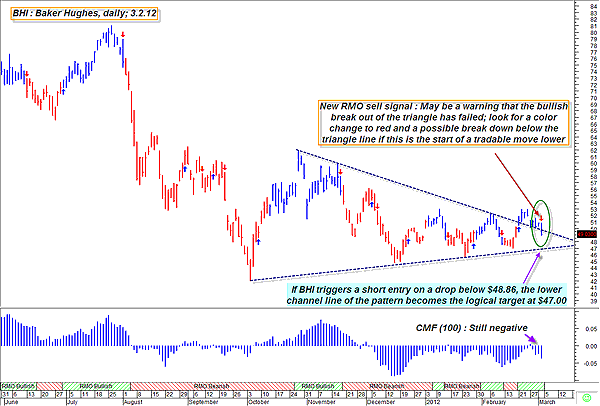
| Some chart patterns take a while to unfold; the large triangle pattern seen here on BHI's daily chart actually had its origins in the major low made back in early October 2011 and then took four-and-half months to play out, culminating in the late February 2012 breakout attempt. Long-term money flow went negative (below its zero line) as the pattern developed, particularly after the second major low within it (mid-December 2011) was made, although it has improved somewhat since then. Finally, as the pattern neared what appeared to be a possible completion area, prices broke higher out of the pattern on February 22, 2012, but the move up was short-lived, almost immediately pulling back to test the upper channel line of the pattern. There was no reemergence of buying interest, however, and now BHI sits within the same triangle pattern once again -- only this time with a fresh Rahul Mohindar (RMO) swing sell signal on its daily chart. Given that the broad market has likely made an intermediate-term cycle high and is heading into some sort of a pullback and/or trend reversal phase, this new short opportunity in BHI has some attractive elements: 1. If the trade triggers an entry on a move below $48.86, the first profit target will likely be the lower channel line of the pattern at $47. By placing a stop-loss above Friday's high at $50.86 and then quickly lowering it to breakeven if $47 is hit (and also taking off half of your position at that price), you may be able to capitalize on the propensity of failed breakouts to move quickly (and sometimes sharply) in the opposite direction. 2. Contrary to all the talk about $5.00 gasoline by summer (nationwide price average), the fact remains that the bullish seasonal pattern in crude oil doesn't typically last much beyond mid-March, and if crude stages a more meaningful correction soon, prices of energy service stocks like BHI will also likely take a hit, too. This short setup in BHI may be the bellwether that is providing savvy traders with an early warning of things yet to come. |

|
| FIGURE 2: BHI, DAILY. Sometimes a failed breakout that starts to quickly move in the opposite direction is one of the lowest-risk, highest-reward trading setups. This may be an excellent short opportunity in shares of Baker Hughes. |
| Graphic provided by: MetaStock. |
| Graphic provided by: RMO trading system indicators from MetaStock 11. |
| |
| The same basic trading strategy described for swing traders can also be adapted for those buying puts in BHI, too. If you see $47 hit after buying your puts, be sure to book a profit on at least half of your position and then bring your stop-loss to breakeven as price reversals off of major chart support points (in this case, the lower triangle channel line) can be sharp and swift, decimating the gains on long put option plays in a hurry. So be smart, take reasonable profits, limit your losses, and never risk more than 1% or 2% of your account's value on any trade, whether it be in stocks, futures, or options. |
Donald W. Pendergast is a financial markets consultant who offers specialized services to stock brokers and high net worth individuals who seek a better bottom line for their portfolios.
| Title: | Writer, market consultant |
| Company: | Linear Trading Systems LLC |
| Jacksonville, FL 32217 | |
| Phone # for sales: | 904-239-9564 |
| E-mail address: | lineartradingsys@gmail.com |
Traders' Resource Links | |
| Linear Trading Systems LLC has not added any product or service information to TRADERS' RESOURCE. | |
Click here for more information about our publications!
PRINT THIS ARTICLE

Request Information From Our Sponsors
- VectorVest, Inc.
- Executive Premier Workshop
- One-Day Options Course
- OptionsPro
- Retirement Income Workshop
- Sure-Fire Trading Systems (VectorVest, Inc.)
- Trading as a Business Workshop
- VectorVest 7 EOD
- VectorVest 7 RealTime/IntraDay
- VectorVest AutoTester
- VectorVest Educational Services
- VectorVest OnLine
- VectorVest Options Analyzer
- VectorVest ProGraphics v6.0
- VectorVest ProTrader 7
- VectorVest RealTime Derby Tool
- VectorVest Simulator
- VectorVest Variator
- VectorVest Watchdog
- StockCharts.com, Inc.
- Candle Patterns
- Candlestick Charting Explained
- Intermarket Technical Analysis
- John Murphy on Chart Analysis
- John Murphy's Chart Pattern Recognition
- John Murphy's Market Message
- MurphyExplainsMarketAnalysis-Intermarket Analysis
- MurphyExplainsMarketAnalysis-Visual Analysis
- StockCharts.com
- Technical Analysis of the Financial Markets
- The Visual Investor
