HOT TOPICS LIST
- MACD
- Fibonacci
- RSI
- Gann
- ADXR
- Stochastics
- Volume
- Triangles
- Futures
- Cycles
- Volatility
- ZIGZAG
- MESA
- Retracement
- Aroon
INDICATORS LIST
LIST OF TOPICS
PRINT THIS ARTICLE
by Gary Grosschadl
Technical analysis on penny stocks can be futile mainly because of liquidity problems. Thinly traded stocks are easily manipulated and their track records can be dubious. Other problems also occur when there are too many outstanding shares (in the hundreds of millions), with stakeholders that have millions of shares to dispose from previous cheap financings. Having said that, some penny plays without the foregoing problems can display readable patterns.
Position: N/A
Gary Grosschadl
Independent Canadian equities trader and technical analyst based in Peterborough
Ontario, Canada.
PRINT THIS ARTICLE
CHART ANALYSIS
This Penny is a Nickel Play
06/04/02 07:45:51 AMby Gary Grosschadl
Technical analysis on penny stocks can be futile mainly because of liquidity problems. Thinly traded stocks are easily manipulated and their track records can be dubious. Other problems also occur when there are too many outstanding shares (in the hundreds of millions), with stakeholders that have millions of shares to dispose from previous cheap financings. Having said that, some penny plays without the foregoing problems can display readable patterns.
Position: N/A
| Donner Minerals trades on the Cdn. TSX Venture Exchange (the former VSE now taken over by the TSE) and on the Frankfurt Exchange in Germany. What makes this play interesting is that it is an area play for The Voisey's Bay nickel deposit. Discovered in 1994 in Newfoundland, it is thought to contain one of the largest nickel finds in the world. Inco, the world's second largest nickel producer, hopes to make a deal with government officials to finally launch a massive multibillion dollar mine development. |
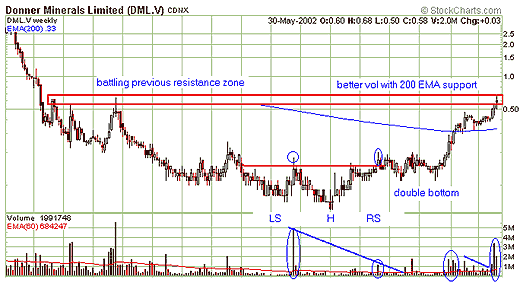
| This little penny play is showing some big stock patterns. On this longer-term weekly chart you can see a head and shoulders bottom. The symmetry between the shoulders is not ideal but the volume fits the pattern. Despite the higher volume breakout from the right shoulder, the move dwindled and appeared to go nowhere. What then transpired was another bottom formation built on top of the last pattern. Note the high volume breakout that ensued after this double bottom formation, making a very nice pop to the 200-day EMA line. Two consolidations on proper declining volume resulted in further bullish upthrusts. |

|
| Graphic provided by: stockcharts.com. |
| |
| The lessons gleaned here are: 1. Be patient when looking for longer-term moves (use weekly and monthly charts as well as dailies) . 2. Look for a base on top of another base to lead to a potential explosive upside move. 3. Watch for volume "triggers" and signs of increased volume activity as a precursor to potentially significant moves. |
| So where does this stock go now? The stock hit a previous resistance zone and has made some nice recent gains, so some consolidation is likely coming. Watch for the next high volume signal to show the stock's next move. The daily charts would be a better time frame for this. Speculative stocks, especially penny stocks, carry more risk, so always factor this in when attempting to "read" these stocks. |
Independent Canadian equities trader and technical analyst based in Peterborough
Ontario, Canada.
| Website: | www.whatsonsale.ca/financial.html |
| E-mail address: | gwg7@sympatico.ca |
Click here for more information about our publications!
Comments
Date: 06/04/02Rank: 4Comment:

Request Information From Our Sponsors
- StockCharts.com, Inc.
- Candle Patterns
- Candlestick Charting Explained
- Intermarket Technical Analysis
- John Murphy on Chart Analysis
- John Murphy's Chart Pattern Recognition
- John Murphy's Market Message
- MurphyExplainsMarketAnalysis-Intermarket Analysis
- MurphyExplainsMarketAnalysis-Visual Analysis
- StockCharts.com
- Technical Analysis of the Financial Markets
- The Visual Investor
- VectorVest, Inc.
- Executive Premier Workshop
- One-Day Options Course
- OptionsPro
- Retirement Income Workshop
- Sure-Fire Trading Systems (VectorVest, Inc.)
- Trading as a Business Workshop
- VectorVest 7 EOD
- VectorVest 7 RealTime/IntraDay
- VectorVest AutoTester
- VectorVest Educational Services
- VectorVest OnLine
- VectorVest Options Analyzer
- VectorVest ProGraphics v6.0
- VectorVest ProTrader 7
- VectorVest RealTime Derby Tool
- VectorVest Simulator
- VectorVest Variator
- VectorVest Watchdog
