HOT TOPICS LIST
- MACD
- Fibonacci
- RSI
- Gann
- ADXR
- Stochastics
- Volume
- Triangles
- Futures
- Cycles
- Volatility
- ZIGZAG
- MESA
- Retracement
- Aroon
INDICATORS LIST
LIST OF TOPICS
PRINT THIS ARTICLE
by Ron Walker
A temporary top appears to be forming on the Russell 2000 as it sinks below support.
Position: N/A
Ron Walker
Ron Walker is an active trader and technical analyst. He operates an educational website dedicated to the study of Technical Analysis. The website offers free market analysis with daily video presentations and written commentaries. Ron is a video pioneer, being one of the first to utilize the internet producing Technical Analysis videos. His website is thechartpatterntrader.com
PRINT THIS ARTICLE
SUPPORT & RESISTANCE
The Russell 2000 Breaks Support
03/06/12 03:27:00 PMby Ron Walker
A temporary top appears to be forming on the Russell 2000 as it sinks below support.
Position: N/A
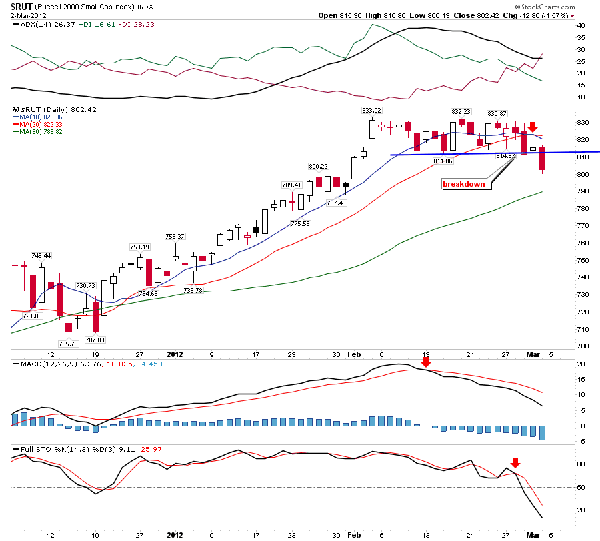
| Figure 1 displays the daily chart of the Russell 2000 small-cap index ($RUT), which has rapidly become overextended. As you can see, in mid-December, prices began to surge, jumping above the 10-, 20-, and 50-period moving averages (MAs). Shortly after that, the move was validated, as the 10-period MA leaped above the 20-period MA. The rally continued until prices finally petered out at 833 in early February. |

|
| FIGURE 1: $RUT, DAILY. The $RUT dipped below support on the last day of February. After a halfhearted one-day rally back to the 20-period MA, prices continued the decline by moving to a fresh low. The ADX triggered a sell signal two days after the break in support. |
| Graphic provided by: StockCharts.com. |
| |
| After peaking in February, $RUT was unable to make new highs as prices came to a screeching halt and did the sidestep throughout the rest of the month. Prices ground through a consolidation that eventually failed to continue the advance. On the last day of February, prices dropped below the 10- and 20-period MAs. The next day, prices rallied into the moving averages for a test but quickly reversed, forming a long upper shadow on $RUT's daily candle. This shadow infers that the bears were lurking at the those MAs, resulting in a halfhearted one-day rally that failed. The 10- and 20-period MAs acted as resistance, pressing down over price. Failing to jump back above the MAs, prices took the path of least resistance and broke below support the following day. The MAs confirmed the weakness that same day as the 10-period MA crossed back below the 20 MA, with the 10 MA now slanting down over the price range in weakness. As prices move lower, both moving averages should eventually point south. |
| The move was also validated by the average directional movement index (ADX) (14) (see Figure 1). As prices plunged below the MAs on the last day of February, the directional indicators (+DI and -DI) got a bearish cross. This means the negative directional indicator (-DI) line crossed above the positive directional indicator (+DI) line. However, to validate this trend finding indicator, we mark the the extreme low in price made when the crossover took place. Once prices close below that level, it will trigger a new sell signal known as the "extreme point rule." Prices closing beyond the extreme low made during the session when the crossover took place triggers the signal. That signal was triggered on March 2, when prices sank below support near 811. |

|
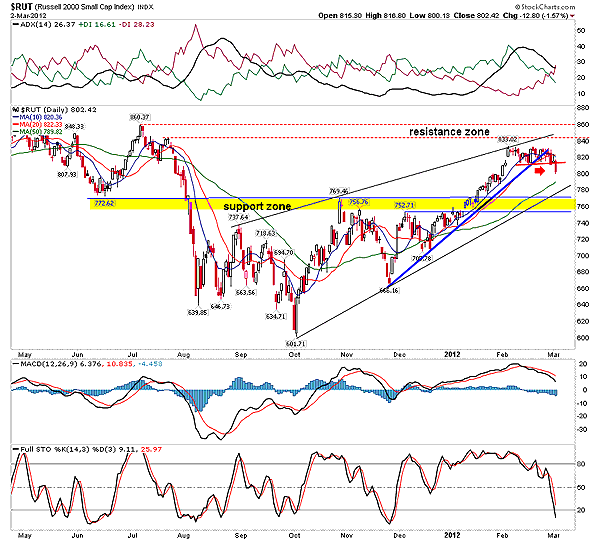
| FIGURE 2: $RUT, DAILY. After testing the July highs and grinding through a brief consolidation, prices turned down, breaking the accelerated trendline and horizontal support. Now the 50-period MA, the trendline from October, and support zone may all be tested. |
| Graphic provided by: StockCharts.com. |
| |
| So with the breach in support, $RUT is likely headed down to the 50-period MA for a test. Now both the 10- and 20-period MAs are still above the 50-period MA. But if the 50-period MA fails to hold as support, eventually they could follow prices back back below it. The Russell would likely need to break below the 50-period MA at 789 and then collapse below the next level of horizontal support at 769 (seen in Figure 2), which was the October high before a new downtrend could get under way. It is also important to note that $RUT is reversing off strong resistance from the two peaks that formed in July (Figure 2), which could influence a change in the longer-term trend. There is a support zone between 752 and 769. We will need to see how prices hold up should the $RUT move below 769. Nevertheless, the Russell has provided clues that the overdue pullback in the market has probably already begun. Will this be a pullback or produce a complete reversal of the trend? The answer lies in whether the support zone can be taken out. |
Ron Walker is an active trader and technical analyst. He operates an educational website dedicated to the study of Technical Analysis. The website offers free market analysis with daily video presentations and written commentaries. Ron is a video pioneer, being one of the first to utilize the internet producing Technical Analysis videos. His website is thechartpatterntrader.com
| Website: | thechartpatterntrader.com |
| E-mail address: | thechartpatterntrader@gmail.com |
Click here for more information about our publications!
PRINT THIS ARTICLE

Request Information From Our Sponsors
- StockCharts.com, Inc.
- Candle Patterns
- Candlestick Charting Explained
- Intermarket Technical Analysis
- John Murphy on Chart Analysis
- John Murphy's Chart Pattern Recognition
- John Murphy's Market Message
- MurphyExplainsMarketAnalysis-Intermarket Analysis
- MurphyExplainsMarketAnalysis-Visual Analysis
- StockCharts.com
- Technical Analysis of the Financial Markets
- The Visual Investor
- VectorVest, Inc.
- Executive Premier Workshop
- One-Day Options Course
- OptionsPro
- Retirement Income Workshop
- Sure-Fire Trading Systems (VectorVest, Inc.)
- Trading as a Business Workshop
- VectorVest 7 EOD
- VectorVest 7 RealTime/IntraDay
- VectorVest AutoTester
- VectorVest Educational Services
- VectorVest OnLine
- VectorVest Options Analyzer
- VectorVest ProGraphics v6.0
- VectorVest ProTrader 7
- VectorVest RealTime Derby Tool
- VectorVest Simulator
- VectorVest Variator
- VectorVest Watchdog
