HOT TOPICS LIST
- MACD
- Fibonacci
- RSI
- Gann
- ADXR
- Stochastics
- Volume
- Triangles
- Futures
- Cycles
- Volatility
- ZIGZAG
- MESA
- Retracement
- Aroon
INDICATORS LIST
LIST OF TOPICS
PRINT THIS ARTICLE
by Matt Blackman
On February 15, my Traders.com Advantage article discussed the soaring S&P 500 and a falling VIX, which together with eurodollar futures and some other indicators pointed to a top in US stocks. Here is another reason for concern.
Position: N/A
Matt Blackman
Matt Blackman is a full-time technical and financial writer and trader. He produces corporate and financial newsletters, and assists clients in getting published in the mainstream media. He is the host of TradeSystemGuru.com. Matt has earned the Chartered Market Technician (CMT) designation. Find out what stocks and futures Matt is watching on Twitter at www.twitter.com/RatioTrade
PRINT THIS ARTICLE
DIVERGENCE INDEX
Another Sign Of A Market Top?
03/08/12 08:35:03 AMby Matt Blackman
On February 15, my Traders.com Advantage article discussed the soaring S&P 500 and a falling VIX, which together with eurodollar futures and some other indicators pointed to a top in US stocks. Here is another reason for concern.
Position: N/A
| A tenet of Dow theory states that trends in major market averages -- that is, the Dow industrials and transports -- must confirm one another if the prevailing trend is to be considered valid. To paraphrase, a bull market in the Dow industrials unconfirmed by similar directional movement in the Dow transports is considered suspect. If industrial production were truly increasing, so too should transport utilization, which the transport index should reflect. |
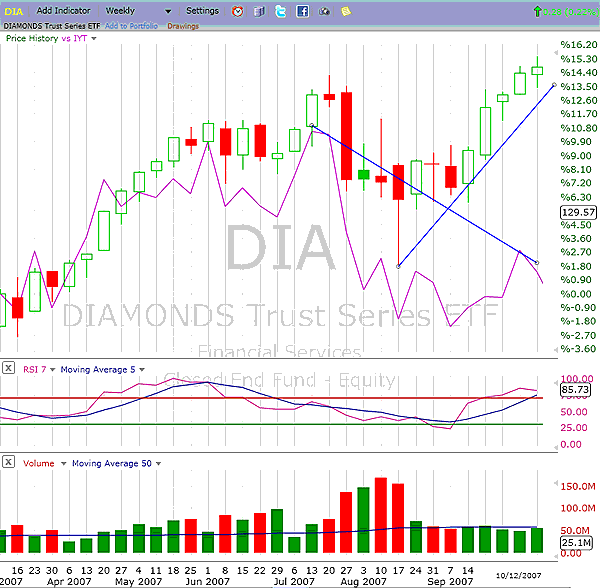
| In August and September 2007, we saw this type of conflict when the Dow transports fell while the Dow industrials continued to rally. Figure 1 shows the clear divergence between the two. We all know what happened shortly thereafter. |

|
| FIGURE 1: DIA, WEEKLY. The weekly chart of the Dow Jones Industrial exchange traded fund (DIA) together with the Dow transport ETF (IYT) showing the divergence between the two in August-September 2007. |
| Graphic provided by: FreeStockCharts.com. |
| |
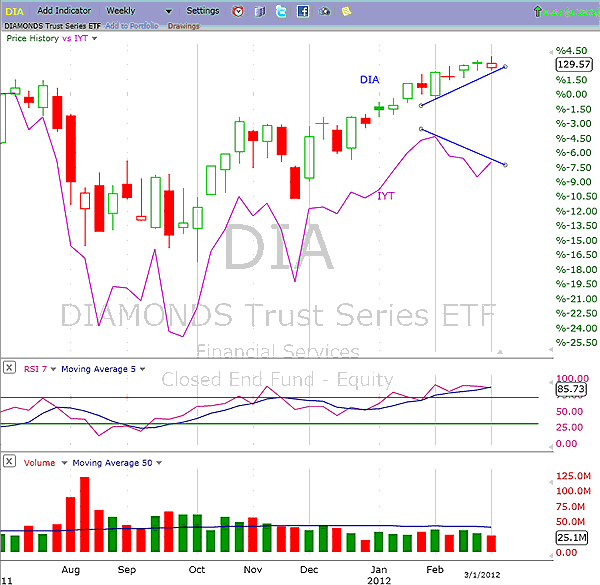
| Now fast forward to February 2012. As the month dawned, each new high in the Dow industrials (DIA) was met with a lower high in the Dow transports, as the IYT exchange traded fund (purple) shows in Figure 2. |

|
| FIGURE 2: DIA, IYT, WEEKLY. The weekly charts of DIA and IYT again show the more recent divergence between the two that began in February 2012. |
| Graphic provided by: FreeStockCharts.com. |
| |
| Few would debate that a number of challenges are facing stocks, not the least of which is rising oil prices, which are increasingly squeezing the consumer and ultimately could threaten the recovery. But there are a number of positives signs, including better-than-expected Purchasing Managers Index (PMI) readings and increasing consumer confidence. So as is usually the case, indicators provide conflicting signals. |
| One major quality that all successful technical traders should possess is the need to keep emotions out of the trading room and instead rely on their indicators to guide them. A divergence between two indexes is only confirmed when a reversal occurs. This divergence is just six weeks old and there is always a chance that transports will recover and the rally will resume. But until that happens, the possibility that a reversal is at hand must be considered and action taken to reduce risk and preserve capital. |
Matt Blackman is a full-time technical and financial writer and trader. He produces corporate and financial newsletters, and assists clients in getting published in the mainstream media. He is the host of TradeSystemGuru.com. Matt has earned the Chartered Market Technician (CMT) designation. Find out what stocks and futures Matt is watching on Twitter at www.twitter.com/RatioTrade
| Company: | TradeSystemGuru.com |
| Address: | Box 2589 |
| Garibaldi Highlands, BC Canada | |
| Phone # for sales: | 604-898-9069 |
| Fax: | 604-898-9069 |
| Website: | www.tradesystemguru.com |
| E-mail address: | indextradermb@gmail.com |
Traders' Resource Links | |
| TradeSystemGuru.com has not added any product or service information to TRADERS' RESOURCE. | |
Click here for more information about our publications!
Comments

Request Information From Our Sponsors
- StockCharts.com, Inc.
- Candle Patterns
- Candlestick Charting Explained
- Intermarket Technical Analysis
- John Murphy on Chart Analysis
- John Murphy's Chart Pattern Recognition
- John Murphy's Market Message
- MurphyExplainsMarketAnalysis-Intermarket Analysis
- MurphyExplainsMarketAnalysis-Visual Analysis
- StockCharts.com
- Technical Analysis of the Financial Markets
- The Visual Investor
- VectorVest, Inc.
- Executive Premier Workshop
- One-Day Options Course
- OptionsPro
- Retirement Income Workshop
- Sure-Fire Trading Systems (VectorVest, Inc.)
- Trading as a Business Workshop
- VectorVest 7 EOD
- VectorVest 7 RealTime/IntraDay
- VectorVest AutoTester
- VectorVest Educational Services
- VectorVest OnLine
- VectorVest Options Analyzer
- VectorVest ProGraphics v6.0
- VectorVest ProTrader 7
- VectorVest RealTime Derby Tool
- VectorVest Simulator
- VectorVest Variator
- VectorVest Watchdog
