HOT TOPICS LIST
- MACD
- Fibonacci
- RSI
- Gann
- ADXR
- Stochastics
- Volume
- Triangles
- Futures
- Cycles
- Volatility
- ZIGZAG
- MESA
- Retracement
- Aroon
INDICATORS LIST
LIST OF TOPICS
PRINT THIS ARTICLE
by Matt Blackman
After putting in what looked like a strong base, Netflix has broken trend. But how far will it drop from here?
Position: N/A
Matt Blackman
Matt Blackman is a full-time technical and financial writer and trader. He produces corporate and financial newsletters, and assists clients in getting published in the mainstream media. He is the host of TradeSystemGuru.com. Matt has earned the Chartered Market Technician (CMT) designation. Find out what stocks and futures Matt is watching on Twitter at www.twitter.com/RatioTrade
PRINT THIS ARTICLE
VOLUME
NetFlix Outlook Looking More Negative
03/06/12 03:10:01 PMby Matt Blackman
After putting in what looked like a strong base, Netflix has broken trend. But how far will it drop from here?
Position: N/A
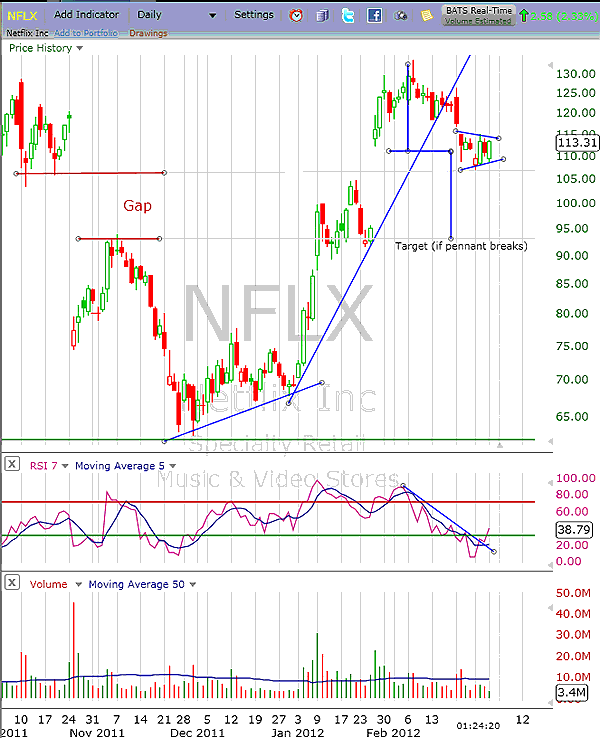
| Online movie rental company NetFlix (NFLX) is a stock that analysts love to hate. It was the first company to go big in the DVD rental by mail and in the movie rental download industry. But after dallying above $300 a share, the stock got pummeled, resulting from a drop in subscriptions when the company divided its DVD-by-mail and online streaming businesses and charged customers for both, nearly doubling the effective cost to subscribers. See Figure 1. |

|
| FIGURE 1: NFLX, DAILY. Daily chart of NFLX showing bearish pennant pattern, which will be confirmed with a decisive breach of the lower pennant pattern. |
| Graphic provided by: FreeStockCharts.com. |
| |
| February 29 marked another milestone for the company as the agreement with Starz to offer hundreds of popular movies expired. |

|
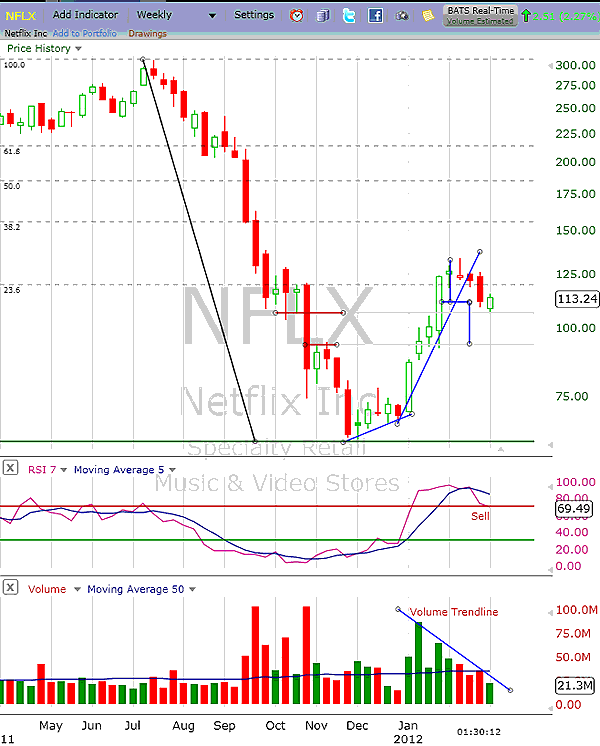
| FIGURE 2: NFLX, WEEKLY. Weekly chart of NFLX showing a longer-term picture. Note that the stock recently generated an RSI sell signal, but that volume has yet to confirm. To confirm selling, the volume needs to breach the downsloping volume trendline (blue line in lower subgraph). NFLX broke above the 23.6 Fibonacci retracement level but then dropped below it, which is bearish. |
| Graphic provided by: FreeStockCharts.com. |
| |
| Technically, the stock is looking worse for wear. As of March 1, NFLX was flashing a bearish pennant pattern supported by a decline in volume that confirms a continuation pattern in the making, just above the top threshold of gap support around $106.25. The sell signal would be confirmed with a breach of the lower upsloping pennant trendline around $110 and further confirmed by a breach of top gap support. It is interesting to note that the minimum downside target if the pennant pattern breaks is right at the bottom of the gap at $93.10. |
| Figure 2 shows the longer-term picture for NFLX. After dropping more than 80% from its high, the stock retraced a little more than 23.6% of the drop but has since rolled over, which is another bearish omen. Also note that the stock has generated a relative strength index (RSI) sell signal (lower subgraph in Figure 2). |
| Fundamentally driven analysts and investors are no doubt concerned about the rapid invasion into the NFLX space of competitors such as Comcast, Amazon, Verizon, Blockbuster, Dish Network, HBO Go, and Hulu, all looking to take market share from NetFlix in the streaming online video market. Technically, traders should be watching pennant and gap support levels on the daily chart and for an increase in selling volume on the weekly chart, which would signal increased selling in the stock. NFLX may try to mount some sort of comeback and may even succeed in breaking above the upper pennant threshold line (around $114), but this could be professional traders moving the stock into a classic buying trap before the stock falls again. |
Matt Blackman is a full-time technical and financial writer and trader. He produces corporate and financial newsletters, and assists clients in getting published in the mainstream media. He is the host of TradeSystemGuru.com. Matt has earned the Chartered Market Technician (CMT) designation. Find out what stocks and futures Matt is watching on Twitter at www.twitter.com/RatioTrade
| Company: | TradeSystemGuru.com |
| Address: | Box 2589 |
| Garibaldi Highlands, BC Canada | |
| Phone # for sales: | 604-898-9069 |
| Fax: | 604-898-9069 |
| Website: | www.tradesystemguru.com |
| E-mail address: | indextradermb@gmail.com |
Traders' Resource Links | |
| TradeSystemGuru.com has not added any product or service information to TRADERS' RESOURCE. | |
Click here for more information about our publications!
Comments

Request Information From Our Sponsors
- StockCharts.com, Inc.
- Candle Patterns
- Candlestick Charting Explained
- Intermarket Technical Analysis
- John Murphy on Chart Analysis
- John Murphy's Chart Pattern Recognition
- John Murphy's Market Message
- MurphyExplainsMarketAnalysis-Intermarket Analysis
- MurphyExplainsMarketAnalysis-Visual Analysis
- StockCharts.com
- Technical Analysis of the Financial Markets
- The Visual Investor
- VectorVest, Inc.
- Executive Premier Workshop
- One-Day Options Course
- OptionsPro
- Retirement Income Workshop
- Sure-Fire Trading Systems (VectorVest, Inc.)
- Trading as a Business Workshop
- VectorVest 7 EOD
- VectorVest 7 RealTime/IntraDay
- VectorVest AutoTester
- VectorVest Educational Services
- VectorVest OnLine
- VectorVest Options Analyzer
- VectorVest ProGraphics v6.0
- VectorVest ProTrader 7
- VectorVest RealTime Derby Tool
- VectorVest Simulator
- VectorVest Variator
- VectorVest Watchdog
