HOT TOPICS LIST
- MACD
- Fibonacci
- RSI
- Gann
- ADXR
- Stochastics
- Volume
- Triangles
- Futures
- Cycles
- Volatility
- ZIGZAG
- MESA
- Retracement
- Aroon
INDICATORS LIST
LIST OF TOPICS
PRINT THIS ARTICLE
by Donald W. Pendergast, Jr.
Shares of Excelon Corp. have been forming a noticeable triangle pattern in the aftermath of January's sharp selloff.
Position: N/A
Donald W. Pendergast, Jr.
Donald W. Pendergast is a financial markets consultant who offers specialized services to stock brokers and high net worth individuals who seek a better bottom line for their portfolios.
PRINT THIS ARTICLE
TRADING SYSTEMS
Is Excelon Energy A New Short Op?
03/06/12 01:34:07 PMby Donald W. Pendergast, Jr.
Shares of Excelon Corp. have been forming a noticeable triangle pattern in the aftermath of January's sharp selloff.
Position: N/A
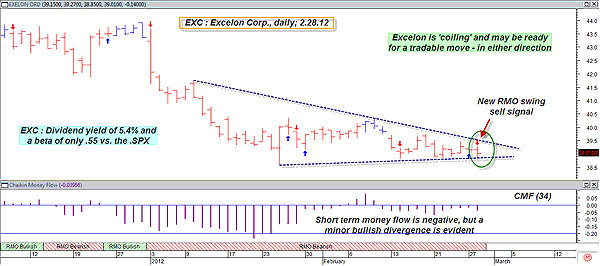
| If you're like most traders and technicians, you'll find that certain types of chart patterns tend to precede reaction moves that are fairly predictable -- at least in most freely traded, liquid markets. In early January 2012, shares of Excelon Corp. (EXC) experienced a shocking selloff day (January 3, 2012) that resulted in further selling that lasted for the next three weeks. During most of this month, the stock has become far less volatile and actually manifested a very noticeable triangle pattern on its daily chart. So, the big question now is whether this current quiet period in EXC is an opportune time for value investors (the stock pays an annual dividend of 5.4%, after all, and has a low beta compared to the .SPX) to scoop up more shares at a discount or if the triangle pattern is warning of the possibility of a continuation move toward lower prices if the pattern is violated to the downside. Here's a closer look at EXC right now (Figure 1). |

|
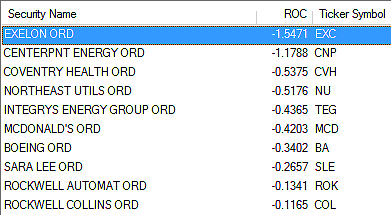
| FIGURE 1: RELATIVE STRENGTH. The weakest relative strength large-cap stocks (versus the .SPX) issuing RMO swing sell signals for February 28, 2012. |
| Graphic provided by: MetaStock. |
| Graphic provided by: MetaStock Explorer. |
| |
| Dividend-paying stocks from the utility sector (stocks of electric, gas and water companies, and so on) tend to pay an above-average yield (the current dividend yield for the .SPX component stocks is 2.1%), and they are generally less prone to violent price movements in either direction -- most of the time -- due to their unique supply/demand nature of the consumer essentials that they provide in the marketplace. So with this latest selloff in EXC, there actually could be an opportunity to add on to an existing position and perhaps sell covered calls to generate even more income, especially since large downside moves in this stock don't happen very often. However, given that many post-selloff triangle patterns give way to further selling, what is an intelligent investor or trader to do with a chart setup like the one depicted in Figure 2? |

|
| FIGURE 2: EXC, DAILY. Trading breakout patterns in low-beta stocks can be tricky, but a breakdown out of this triangle on EXC's daily chart may just offer savvy traders an opportunity to initiate a well-thought-out scale trading strategy. |
| Graphic provided by: MetaStock. |
| Graphic provided by: RMO trading system indicators from MetaStock 11. |
| |
| Here is a possible answer to that question: Employ a scale trading strategy if EXC starts to break down out of the triangle. Here's the logic behind this trading idea: 1. EXC, being a low-beta stock, doesn't tend to get too enthusiastic about sustained trend moves in either direction. 2. The stock's high dividend tends to offer a measure of fundamental price support. 3. Instigating a scale trading strategy is arguably safer on a low-beta, high-yielding stock that it is on a volatile, nondividend issue. Let's say that it would be a major move if EXC was to sell off another 10% from current price levels. If a trader were to start with 50 shares at say $38.50, 65 at $37.50, 85 at $36.50, and 100 at $35.50, he would have allocated a total of $11,016 (before commissions and slippage) to acquire 300 shares. That's an average price per share of $36.72, and unless EXC's business model suddenly becomes not viable (not likely), it seems improbable that EXC will just keep on falling. But say that happens and a trader could actually commit to such a strategy. What's the upside? Here's the game plan: 1. The investor/trader is earning a 5.4% dividend, or more than $594 per year. 2. Any move above $36.78 (not including commissions and slippage) will result in a capital-gains opportunity. 3. A variety of call options could be sold against the shares to generate additional income. Of course, the call strikes should be above the breakeven price of $36.72 to ensure that gains can be made on both the stock and options sides of the trades. A trader could even sell a $37.50 call, a $40 call, and a $42.50 call using different expiration dates, depending on whether EXC starts to swing higher again (after our hypothetical 10% selloff) or just grind sideways for a time. Risk? Of course, there is risk involved in all trading, so why not just set a maximum risk of 1% of your account value for the entire position. So if you have a $50,000 stock account, you could risk $500 on this trade. Since we have 300 shares, that means we simply divide $500 by 300 shares to determine our per share risk, which in this case is $1.67 per share. Since our average price is $36.72, our stop-loss will be at $36.72 - $1.67 or $35.05. If EXC were to make a daily close below that price once all the position is on, you would simply sell all 300 shares for a loss. |
| Now, let's be real here -- no one knows what's going to happen with EXC in the days and weeks ahead, but this strategy framework should at least give you an idea of the profit potential of a scale trading strategy in large-cap, low-beta, high-yield stocks in the utility sector. Strategies like this aren't glamorous, but variations of it are deployed by conservative investors and traders around the globe. See if you can also identify various utility sector stocks with the same beta and yield qualities as EXC and see if you also can't come up with a viable scale trading/covered-call trading strategy that might help you bring in a combination of option, stock, and dividend profits. |
Donald W. Pendergast is a financial markets consultant who offers specialized services to stock brokers and high net worth individuals who seek a better bottom line for their portfolios.
| Title: | Writer, market consultant |
| Company: | Linear Trading Systems LLC |
| Jacksonville, FL 32217 | |
| Phone # for sales: | 904-239-9564 |
| E-mail address: | lineartradingsys@gmail.com |
Traders' Resource Links | |
| Linear Trading Systems LLC has not added any product or service information to TRADERS' RESOURCE. | |
Click here for more information about our publications!
PRINT THIS ARTICLE

Request Information From Our Sponsors
- VectorVest, Inc.
- Executive Premier Workshop
- One-Day Options Course
- OptionsPro
- Retirement Income Workshop
- Sure-Fire Trading Systems (VectorVest, Inc.)
- Trading as a Business Workshop
- VectorVest 7 EOD
- VectorVest 7 RealTime/IntraDay
- VectorVest AutoTester
- VectorVest Educational Services
- VectorVest OnLine
- VectorVest Options Analyzer
- VectorVest ProGraphics v6.0
- VectorVest ProTrader 7
- VectorVest RealTime Derby Tool
- VectorVest Simulator
- VectorVest Variator
- VectorVest Watchdog
- StockCharts.com, Inc.
- Candle Patterns
- Candlestick Charting Explained
- Intermarket Technical Analysis
- John Murphy on Chart Analysis
- John Murphy's Chart Pattern Recognition
- John Murphy's Market Message
- MurphyExplainsMarketAnalysis-Intermarket Analysis
- MurphyExplainsMarketAnalysis-Visual Analysis
- StockCharts.com
- Technical Analysis of the Financial Markets
- The Visual Investor
