HOT TOPICS LIST
- MACD
- Fibonacci
- RSI
- Gann
- ADXR
- Stochastics
- Volume
- Triangles
- Futures
- Cycles
- Volatility
- ZIGZAG
- MESA
- Retracement
- Aroon
INDICATORS LIST
LIST OF TOPICS
PRINT THIS ARTICLE
by Chaitali Mohile
Will the stock break the previous high resistance?
Position: N/A
Chaitali Mohile
Active trader in the Indian stock markets since 2003 and a full-time writer. Trading is largely based upon technical analysis.
PRINT THIS ARTICLE
TECHNICAL ANALYSIS
Caterpillar Ready To Break Out?
03/06/12 01:18:16 PMby Chaitali Mohile
Will the stock break the previous high resistance?
Position: N/A
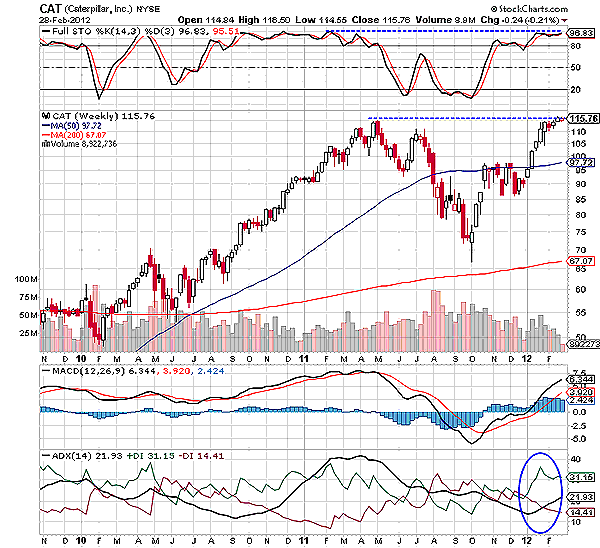
| As you can see from the weekly chart of Caterpillar (CAT) in Figure 1, the stock was in a long-term bullish rally since 2010. The ascending price action paused at 115 levels. Note the negative divergence between price movement and the full stochastic (14,3,3). This was an indication of a weakening in the rally. CAT formed a top at 115 levels, indicating a bullish reversal rally. In addition, the average directional index (ADX) (14) showed a bullish trend reversal signal. Thereafter, the stock plunged below the 50-day moving average (MA) support. Gradually, the declining rally retraced towards its long-term support of a 200-day moving average (MA). The downward price movements reversed from this MA support. The previous high of 115 is the major resistance for the pullback rally. |

|
| FIGURE 1: CAT, WEEKLY |
| Graphic provided by: StockCharts.com. |
| |
| Currently, CAT is struggling near the resistance (see the blue dotted line). A fresh uptrend is developing. The moving average convergence/divergence (MACD) (12,26,9) is positive, indicating a bullish momentum in the rally. The highly overbought stochastic oscillator could be an indication that prices may pullback to consolidate near resistance. The oscillator could plunge a few points to create some room for the future breakout rally. Since the other two indicators are bullish, we can anticipate an upward breakout in the near future. Traders and investors can enter the fresh long positions at this breakout point. |

|
| FIGURE 2: CAT, DAILY |
| Graphic provided by: StockCharts.com. |
| |
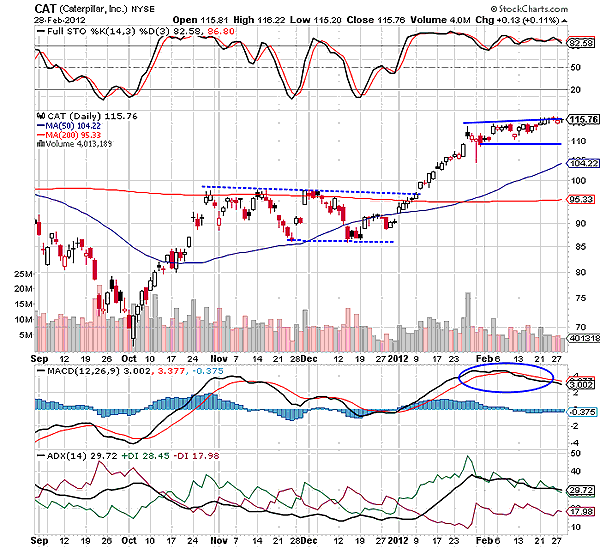
| Now let us turn to the daily chart (Figure 2). CAT was consolidating under the 200-day MA resistance for about two months. A bullish breakout at 95 levels dragged the stock into a bullish region above the 50-day and 200-day MA supports. Later, the rally moved horizontally. The stochastic was highly oberbought and the MACD (12,26,9) was moving lower. This points to the possibility of a sideways consolidation. The consolidating rally formed a bullish flag & pennant formation on the daily time frame. This pattern is a bullish continuation and the upward breakout resumes the prior advance rally; hence, CAT would climb to higher levels after the bullish breakout occurred on the chart. The potential target for CAT would be 115 - 95 = 25 (length of flag pole) + 115 (breakout level) = 140 levels. This target is very attractive for short and medium-term traders. |
| The negative MACD (12,26,9), the developing uptrend, and an overbought stochastic oscillator would help CAT surge to a new high of 140 levels. |
| Thus, CAT is one of the top list candidates. The stock is getting ready to undergo the bullish breakout. |
Active trader in the Indian stock markets since 2003 and a full-time writer. Trading is largely based upon technical analysis.
| Company: | Independent |
| Address: | C1/3 Parth Indraprasth Towers. Vastrapur |
| Ahmedabad, Guj 380015 | |
| E-mail address: | chaitalimohile@yahoo.co.in |
Traders' Resource Links | |
| Independent has not added any product or service information to TRADERS' RESOURCE. | |
Click here for more information about our publications!
PRINT THIS ARTICLE

Request Information From Our Sponsors
- StockCharts.com, Inc.
- Candle Patterns
- Candlestick Charting Explained
- Intermarket Technical Analysis
- John Murphy on Chart Analysis
- John Murphy's Chart Pattern Recognition
- John Murphy's Market Message
- MurphyExplainsMarketAnalysis-Intermarket Analysis
- MurphyExplainsMarketAnalysis-Visual Analysis
- StockCharts.com
- Technical Analysis of the Financial Markets
- The Visual Investor
- VectorVest, Inc.
- Executive Premier Workshop
- One-Day Options Course
- OptionsPro
- Retirement Income Workshop
- Sure-Fire Trading Systems (VectorVest, Inc.)
- Trading as a Business Workshop
- VectorVest 7 EOD
- VectorVest 7 RealTime/IntraDay
- VectorVest AutoTester
- VectorVest Educational Services
- VectorVest OnLine
- VectorVest Options Analyzer
- VectorVest ProGraphics v6.0
- VectorVest ProTrader 7
- VectorVest RealTime Derby Tool
- VectorVest Simulator
- VectorVest Variator
- VectorVest Watchdog
