

HOT TOPICS LIST
- MACD
- Fibonacci
- RSI
- Gann
- ADXR
- Stochastics
- Volume
- Triangles
- Futures
- Cycles
- Volatility
- ZIGZAG
- MESA
- Retracement
- Aroon
INDICATORS LIST
LIST OF TOPICS
PRINT THIS ARTICLE
by Alan R. Northam
Statistical analysis shows Pfizer in the process of turning down.
Position: N/A
Alan R. Northam
Alan Northam lives in the Dallas, Texas area and as an electronic engineer gave him an analytical mind from which he has developed a thorough knowledge of stock market technical analysis. His abilities to analyze the future direction of the stock market has allowed him to successfully trade of his own portfolio over the last 30 years. Mr. Northam is now retired and trading the stock market full time. You can reach him at inquiry@tradersclassroom.com or by visiting his website at http://www.tradersclassroom.com. You can also follow him on Twitter @TradersClassrm.
PRINT THIS ARTICLE
STATISTICS
Pfizer Is Turning Down
03/05/12 01:48:01 PMby Alan R. Northam
Statistical analysis shows Pfizer in the process of turning down.
Position: N/A
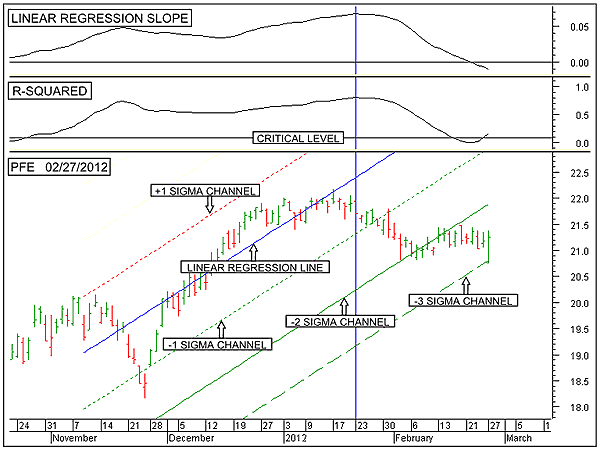
| Figure 1 shows the daily bar chart of Pfizer (PFE) in the bottom window. The blue line running through the middle of the chart is the 50-day linear regression line representing the intermediate-term trend. This chart also shows the -1 sigma channel line (dotted green), the -2 sigma channel line (solid green), the -3 sigma channel line (dashed green), and the +1 sigma channel line (dotted red line). The top window shows the linear regression slope indicator and the middle window the R-squared indicator. |
|
| FIGURE 1: PFE, DAILY. Here is the daily price chart of Pfizer in the bottom window along with the 50-day linear regression line and its associated channel lines. The linear regression slope is shown in the top window, and the R-squared indicator is shown in the middle window. |
| Graphic provided by: MetaStock. |
| |
| The proper positioning of the linear regression line is to place its end point at the steepest momentum point. This is represented by the vertical blue line. The starting of the linear regression line is then placed back 50 trading days. The linear regression line is extended forward to the right of the vertical blue line. All channel lines are placed in the same manner as the linear regression line. The +1 and -1 sigma channel lines represent the boundaries in which price should statistically trade over 68% of the time. The +2 and -2 sigma channel lines (+2 sigma channel line not shown) represent the boundaries in which price should trade 95% of the time. Note also that price should only trade between the -2 sigma channel line and the -3 sigma channel line 2.5% of the time. When price trades between these boundaries, something significant is taking place, as trading between these two boundaries does not occur very often. I identify a closing price below the lower 2 sigma channel line as a warning of a change in trend. The +3 and -3 sigma channel lines (+3 sigma channel line not shown) represent the boundaries in which price should trade 100% of the time. A closing price below the -3 sigma channel line represents a change in trend. From Figure 1, it can be seen that a warning of a change in trend has already occurred, but the actual change in trend has not. |
| There exists another method of determining when a change in trend has occurred using statistics. This method involves plotting the slope of the linear regression line. Such a plot is shown in the top window of Figure 1. Figure 1 shows the linear regression slope indicator. When this indicator moves below its zero line, it is an indication that the trend over the time period plotted has reversed directions. Note that this indicator is indicating that over the intermediate term, the trend has now reversed from an uptrend to a downtrend. |
| In the world of statistics we also have a way of measuring the strength of a trend. This measurement is made using the coefficient of determination noted by "R" with a superscripted 2 to represent that the "R" term has been squared. We call it R-squared. The coefficient of determination simply states that as time moves forward each day, the closing price will continue to move lower. When the R-squared indicator moves above its critical level, it is saying that statistically there is now a 95% confidence level that price will continue to move lower each day. Thus, when the linear regression slope indicator has crossed below its zero line and the R-squared indicator has moved above its critical level, it is a strong indication that a change in trend has occurred. |
| Figure 1 shows two methods used to indicate a change in trend. One method is to wait for price to move below its -3 sigma channel line. The second method involves the linear regression slope indicator moving below its zero line and the R-squared indicator moving above its critical level. When both methods indicate a change in trend, then one confirms the other. When only one of the two methods indicate a change in trend, we have a divergence. Currently, there exists a divergence between the two methods of statistically determining a change in trend. As long as this divergence exists, there is a possibility that a change in trend will not occur. The longer that this divergence exists, the greater the possibility that a change in trend will not happen. As the title says, "Pfizer Is Turning Down," but it has not yet done so. |
Alan Northam lives in the Dallas, Texas area and as an electronic engineer gave him an analytical mind from which he has developed a thorough knowledge of stock market technical analysis. His abilities to analyze the future direction of the stock market has allowed him to successfully trade of his own portfolio over the last 30 years. Mr. Northam is now retired and trading the stock market full time. You can reach him at inquiry@tradersclassroom.com or by visiting his website at http://www.tradersclassroom.com. You can also follow him on Twitter @TradersClassrm.
| Garland, Tx | |
| Website: | www.tradersclassroom.com |
| E-mail address: | inquiry@tradersclassroom.com |
Click here for more information about our publications!
PRINT THIS ARTICLE

Request Information From Our Sponsors
- StockCharts.com, Inc.
- Candle Patterns
- Candlestick Charting Explained
- Intermarket Technical Analysis
- John Murphy on Chart Analysis
- John Murphy's Chart Pattern Recognition
- John Murphy's Market Message
- MurphyExplainsMarketAnalysis-Intermarket Analysis
- MurphyExplainsMarketAnalysis-Visual Analysis
- StockCharts.com
- Technical Analysis of the Financial Markets
- The Visual Investor
- VectorVest, Inc.
- Executive Premier Workshop
- One-Day Options Course
- OptionsPro
- Retirement Income Workshop
- Sure-Fire Trading Systems (VectorVest, Inc.)
- Trading as a Business Workshop
- VectorVest 7 EOD
- VectorVest 7 RealTime/IntraDay
- VectorVest AutoTester
- VectorVest Educational Services
- VectorVest OnLine
- VectorVest Options Analyzer
- VectorVest ProGraphics v6.0
- VectorVest ProTrader 7
- VectorVest RealTime Derby Tool
- VectorVest Simulator
- VectorVest Variator
- VectorVest Watchdog