HOT TOPICS LIST
- MACD
- Fibonacci
- RSI
- Gann
- ADXR
- Stochastics
- Volume
- Triangles
- Futures
- Cycles
- Volatility
- ZIGZAG
- MESA
- Retracement
- Aroon
INDICATORS LIST
LIST OF TOPICS
PRINT THIS ARTICLE
by Mike Carr, CMT
Stocks climb a wall of worry, and the bears could be providing enough worries to drive stocks to all-time highs.
Position: Buy
Mike Carr, CMT
Mike Carr, CMT, is a member of the Market Technicians Association, and editor of the MTA's newsletter, Technically Speaking. He is also the author of "Smarter Investing in Any Economy: The Definitive Guide to Relative Strength Investing," and "Conquering the Divide: How to Use Economic Indicators to Catch Stock Market Trends."
PRINT THIS ARTICLE
ANDREWS PITCH-FORK
S&P 500 Could Set New Highs By Summer
03/02/12 09:08:07 AMby Mike Carr, CMT
Stocks climb a wall of worry, and the bears could be providing enough worries to drive stocks to all-time highs.
Position: Buy
| Traders like to say things like "the trend is your friend" and "don't fight the Fed." They usually turn to adages like that at the start of a new trend. After a trend is several years old, however, it becomes easy to forget the basics as nervousness replaces the certainty that traders initially feel. By some counts, the current bull market is nearly three years old and traders are anxiously awaiting a reversal. Those traders are missing the fact that this bull market may be less than five months old. Last year, stocks fell nearly 20% and some indexes exceeded that. The decline lasted about five months and bottomed in October; that could qualify as a bear market decline. New bull markets often start explosively, and that defines the move we've seen recently. |
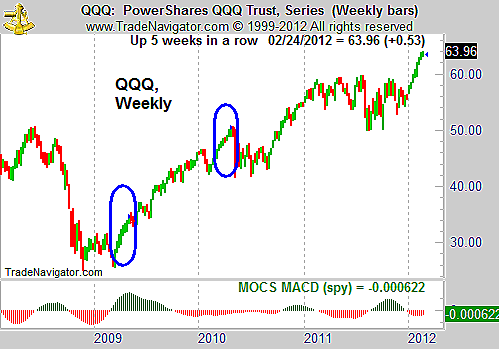
| Another trader truth is that growth outperforms in a bull market. There are a number of ways to find growth stocks, but the simplest is probably to look at the NASDAQ 100, which is a collection of tech stocks. This is one of the most aggressive sectors in the market, and it has been moving steadily higher in the past few weeks. We have now seen eight consecutive up closes in the NASDAQ 100 (Figure 1). |

|
| FIGURE 1: NASDAQ 100 ETF, WEEKLY. The NASDAQ 100 exchange traded fund (QQQ) has delivered a number of up weeks in a row twice, usually indicating that further gains are ahead. |
| Graphic provided by: Trade Navigator. |
| |
| A string of up closes often leads to the argument that a move is exhausted and a reversal is due. The data shows a different story. A trading strategy that buys after eight up weeks and exits on a time-stop would deliver profits over any holding period ranging from one week to 52 weeks. After a holding period of at least six months, the profit factors for this strategy are all in double digits, with 85% of the trades being profitable. The profit factor gives the ratio of gross profit compared to gross losses. Having a profit factor greater than 1.00 signifies there is more gross profit than gross loss. For the sake of comparison, the profit factors on a buy & hold strategy for the NASDAQ 100 range are generally between 3 and 5.5 for similar holding periods. Buying after eight up weeks has proven to be at least twice as profitable as buy & hold in the past. |
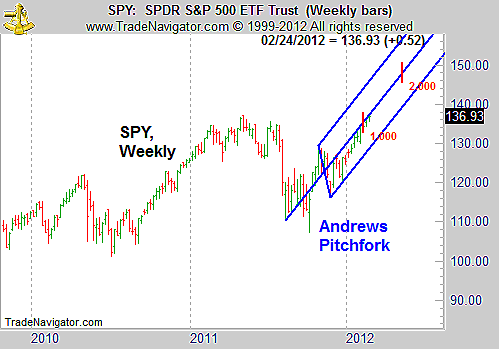
| The more widely followed Standard & Poor's 500 is also bullish, and one chart pattern suggests that it could challenge its old highs by the summer. Andrews' pitchfork is a line study consisting of three parallel trendlines based on an important high or low, and the first moves from that point. Using the summer low, the first bounce into the October high, and then the December low, the pitchfork would be drawn as shown in Figure 2. Prices generally move within the lines and when a trend is broken, a new pitchfork is drawn. This technique shows that the SPY could trade near $150 by July. |

|
| FIGURE 2: S&P 500 ETF, WEEKLY. Andrews’ pitchfork has so far contained the bullish move in the S&P 500 and offers traders a guide for trading in the next few months. |
| Graphic provided by: Trade Navigator. |
| |
| Many of the analysts who are bearish currently are ignoring the strong bullish trends that are visible on the charts of major stock market indexes. There have been a number of consecutive up weeks recorded in most of the indexes, and this indicates an uptrend has begun. If the trend is your friend, traders should be bullish. The Fed has said they will not be raising rates for two more years, and that is also bullish. Traders looking to take advantage of this new bull market should consider being long the most aggressive sectors in the stock market. |
Mike Carr, CMT, is a member of the Market Technicians Association, and editor of the MTA's newsletter, Technically Speaking. He is also the author of "Smarter Investing in Any Economy: The Definitive Guide to Relative Strength Investing," and "Conquering the Divide: How to Use Economic Indicators to Catch Stock Market Trends."
| Website: | www.moneynews.com/blogs/MichaelCarr/id-73 |
| E-mail address: | marketstrategist@gmail.com |
Click here for more information about our publications!
PRINT THIS ARTICLE

Request Information From Our Sponsors
- StockCharts.com, Inc.
- Candle Patterns
- Candlestick Charting Explained
- Intermarket Technical Analysis
- John Murphy on Chart Analysis
- John Murphy's Chart Pattern Recognition
- John Murphy's Market Message
- MurphyExplainsMarketAnalysis-Intermarket Analysis
- MurphyExplainsMarketAnalysis-Visual Analysis
- StockCharts.com
- Technical Analysis of the Financial Markets
- The Visual Investor
- VectorVest, Inc.
- Executive Premier Workshop
- One-Day Options Course
- OptionsPro
- Retirement Income Workshop
- Sure-Fire Trading Systems (VectorVest, Inc.)
- Trading as a Business Workshop
- VectorVest 7 EOD
- VectorVest 7 RealTime/IntraDay
- VectorVest AutoTester
- VectorVest Educational Services
- VectorVest OnLine
- VectorVest Options Analyzer
- VectorVest ProGraphics v6.0
- VectorVest ProTrader 7
- VectorVest RealTime Derby Tool
- VectorVest Simulator
- VectorVest Variator
- VectorVest Watchdog
