HOT TOPICS LIST
- MACD
- Fibonacci
- RSI
- Gann
- ADXR
- Stochastics
- Volume
- Triangles
- Futures
- Cycles
- Volatility
- ZIGZAG
- MESA
- Retracement
- Aroon
INDICATORS LIST
LIST OF TOPICS
PRINT THIS ARTICLE
by James Kupfer
Gold seems to have upside potential left, but how far will it go?
Position: Buy
James Kupfer
Mr. Kupfer is a market professional and amateur stock market commentator. Disclosure: It is likely that Mr. Kupfer has or will enter a position in any security he writes about.
PRINT THIS ARTICLE
FIBONACCI
Gold Still Shining, But For How Much Longer?
03/01/12 02:09:24 PMby James Kupfer
Gold seems to have upside potential left, but how far will it go?
Position: Buy
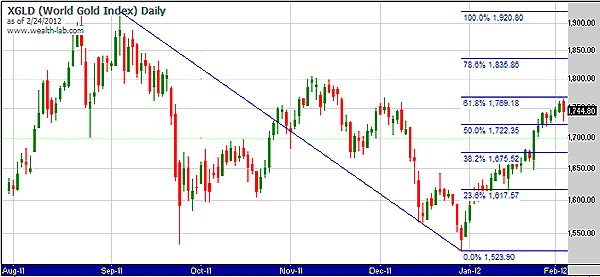
| At the very end of January, I suggested that gold was due for a temporary pullback before it would likely resume its upward move. On February 3, gold reached an intraday high of almost 1766, which was points above the resistance levels I had indicated and points below the Fibonacci level shown on Figure 1. |

|
| FIGURE 1: XGLD, DAILY |
| Graphic provided by: Wealth-Lab. |
| |
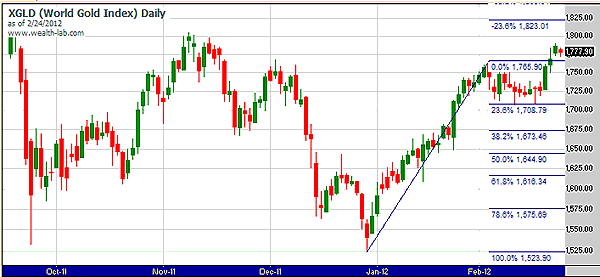
| As you can see in Figure 2, gold retreated the bare minimum 23.6%. It touched the 1709 level twice on an intraday basis over the following weeks and has subsequently moved higher. So where will gold go now? |

|
| FIGURE 2: XGLD, DAILY |
| Graphic provided by: Wealth-Lab. |
| |
| Having moved above its previous resistance point at 1766, that level now becomes support for gold. In addition, that gold only retraced a very minor amount is a testament to its underlying strength. On the flip side, I would actually have found it more comforting had gold retraced further to the 1765 level to build more of a base and support the continuation of a move up. |
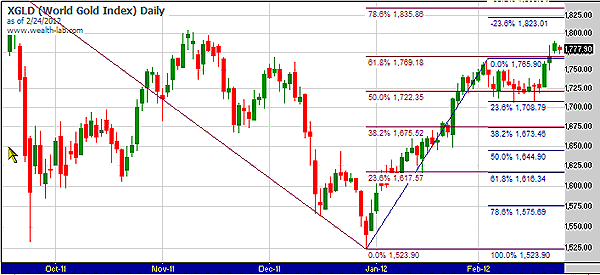
| That said, the 1778 level seems to be a reasonable buying point with a stop around 1765. The expectation would be a continuation of the move upward to a minimum price target of 1823. The 1836 level is more significant and would present a much more difficult target to exceed should it be reached. See Figure 3. |

|
| FIGURE 3: XGLD, DAILY |
| Graphic provided by: Wealth-Lab. |
| |
Mr. Kupfer is a market professional and amateur stock market commentator. Disclosure: It is likely that Mr. Kupfer has or will enter a position in any security he writes about.
Click here for more information about our publications!
PRINT THIS ARTICLE

Request Information From Our Sponsors
- StockCharts.com, Inc.
- Candle Patterns
- Candlestick Charting Explained
- Intermarket Technical Analysis
- John Murphy on Chart Analysis
- John Murphy's Chart Pattern Recognition
- John Murphy's Market Message
- MurphyExplainsMarketAnalysis-Intermarket Analysis
- MurphyExplainsMarketAnalysis-Visual Analysis
- StockCharts.com
- Technical Analysis of the Financial Markets
- The Visual Investor
- VectorVest, Inc.
- Executive Premier Workshop
- One-Day Options Course
- OptionsPro
- Retirement Income Workshop
- Sure-Fire Trading Systems (VectorVest, Inc.)
- Trading as a Business Workshop
- VectorVest 7 EOD
- VectorVest 7 RealTime/IntraDay
- VectorVest AutoTester
- VectorVest Educational Services
- VectorVest OnLine
- VectorVest Options Analyzer
- VectorVest ProGraphics v6.0
- VectorVest ProTrader 7
- VectorVest RealTime Derby Tool
- VectorVest Simulator
- VectorVest Variator
- VectorVest Watchdog
