HOT TOPICS LIST
- MACD
- Fibonacci
- RSI
- Gann
- ADXR
- Stochastics
- Volume
- Triangles
- Futures
- Cycles
- Volatility
- ZIGZAG
- MESA
- Retracement
- Aroon
INDICATORS LIST
LIST OF TOPICS
PRINT THIS ARTICLE
by Billy Williams
Price gaps don't just reflect changes in demand for a stock but can indicate whether a stock will break away, gather momentum, or signal a trend reversal, which is why you need to know these three types of gaps.
Position: N/A
Billy Williams
Billy Williams has been trading the markets for 27 years, specializing in momentum trading with stocks and options.
PRINT THIS ARTICLE
RUNAWAY GAP
The Three Major Price Gaps For Trading
03/01/12 02:03:37 PMby Billy Williams
Price gaps don't just reflect changes in demand for a stock but can indicate whether a stock will break away, gather momentum, or signal a trend reversal, which is why you need to know these three types of gaps.
Position: N/A
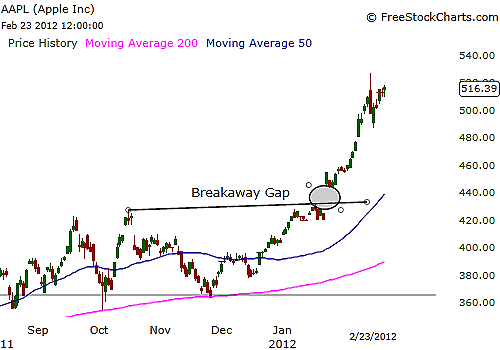
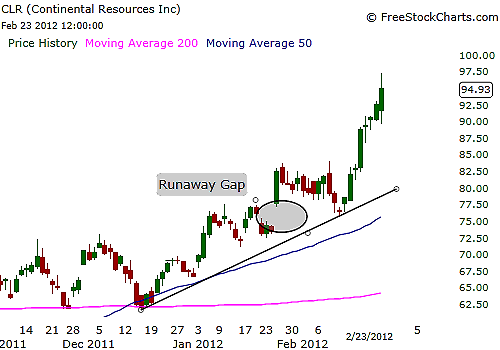
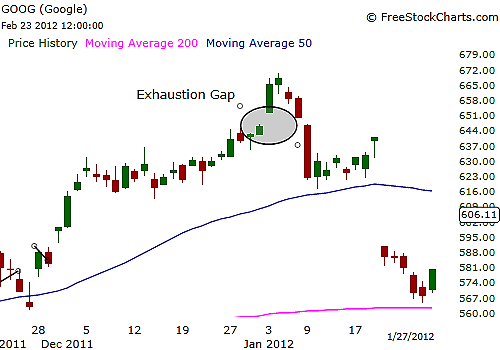
| A price gap is when in a stock's price movement of the current trading day opens outside the intraday high and low of the previous trading day and it is in itself a strong indicator to gauge the demand for a particular stock. As such, it can be a strong indicator on whether the current stock valuation has been perceived as too high or too low with traders and investors alike, piling on new positions or running for the exits. The reason why you want to trade gaps is that they reveal where both value and demand are in sync and where momentum is gathering strength in that direction along with accelerating velocity. By using gaps effectively, you can put yourself on the right side of that movement and profit handsomely. Gaps can be spotted with price bars or candlestick bars and there are several classifications of price gaps, but there are only three types that you really need to look for: the breakaway gap (Figure 1), the runaway gap (Figure 2), and the exhaustion gap (Figure 3). |

|
| FIGURE 1: APPLE. AAPL was stuck in a range recently until it formed a breakaway gap and moved to higher ground. |
| Graphic provided by: www.freestockcharts.com. |
| |
| The breakaway gap is the easiest to spot and can be the most useful of the three gaps for trading. When a stock's price is in a period of consolidation or trading within a tight range, some outside event such as a major trading institution putting in a big buy order may cause the stock to break out of the trading range as well as open and close outside the previous trading day's intraday price range. This typically occurs on heavier volume and while some of the gap may be closed in the succeeding trading days, there is usually some part of the gap's range that is left unfilled as the new demand for the stock results in large groups of traders and investors taking position in the direction of the new trend. In short, the unfilled gap remains as a testament to the strength of the emerging trend that has taken place. |

|
| FIGURE 2: CONTINENTAL RESOURCES. CLR has been a fast-moving stock and formed a runaway gap in the direction of the trend as bullish traders piled on positions in order to not be left behind. |
| Graphic provided by: www.freestockcharts.com. |
| |
| The runaway gap occurs in a stock that already has an established trend in a given direction but it results as demand for the stock increases as it continues its movement in that direction. Seasoned traders and investors will typically wait for a pullback or retracement to take a position in a trend, but when a stock is moving fast, it is the less-experienced speculators who continue to jump in on the move out of fear of missing out on potential profits. This piling on results in a strong gap in the direction of the established trend where, once again, the gap opens and closes outside the intraday high and low of the previous trading day. When a runaway gap closes at the end of its day, it can close at or near its intraday high or low, depending on the context of the market, which can indicate that strong price action can be expected the following trading day as well, often with the stock continuing to move in the direction of the trend. |

|
| FIGURE 3: GOOGLE. GOOG foundered at the beginning of 2012 as an exhaustion gap formed and broke the uptrend, with a price decline that followed as a result. |
| Graphic provided by: www.freestockcharts.com. |
| |
| The exhaustion gap carries quite a bit of significance compared to the previous two gaps because it reveals when the trend is over. When an established trend has run its course, an exhaustion gap tends to be the Johnny-come-latelys that have come to the party too late by taking positions at the last segment of a trend that is coming to an end. This group of traders usually are smaller players with limited resources, but once enough of them come together to take the last few positions, they create a final surge, resulting in a gap that is marked by a big spike in volume, but then price reverses, as there are no newer positions coming in behind them, exhausting any buying and selling before price reverses in the opposite direction. |
| Gaps can be immensely valuable to an astute trader and by taking the time to master the mechanics of each of the three major gaps that occur each day in the market, you add to your trader's arsenal a tool that will help you spot the beginning of an explosive new trend, latch on to strongly moving stocks, step aside when the trend is over and be ready to catch a new emerging trend in the opposite direction. |
Billy Williams has been trading the markets for 27 years, specializing in momentum trading with stocks and options.
| Company: | StockOptionSystem.com |
| E-mail address: | stockoptionsystem.com@gmail.com |
Traders' Resource Links | |
| StockOptionSystem.com has not added any product or service information to TRADERS' RESOURCE. | |
Click here for more information about our publications!
PRINT THIS ARTICLE

Request Information From Our Sponsors
- StockCharts.com, Inc.
- Candle Patterns
- Candlestick Charting Explained
- Intermarket Technical Analysis
- John Murphy on Chart Analysis
- John Murphy's Chart Pattern Recognition
- John Murphy's Market Message
- MurphyExplainsMarketAnalysis-Intermarket Analysis
- MurphyExplainsMarketAnalysis-Visual Analysis
- StockCharts.com
- Technical Analysis of the Financial Markets
- The Visual Investor
- VectorVest, Inc.
- Executive Premier Workshop
- One-Day Options Course
- OptionsPro
- Retirement Income Workshop
- Sure-Fire Trading Systems (VectorVest, Inc.)
- Trading as a Business Workshop
- VectorVest 7 EOD
- VectorVest 7 RealTime/IntraDay
- VectorVest AutoTester
- VectorVest Educational Services
- VectorVest OnLine
- VectorVest Options Analyzer
- VectorVest ProGraphics v6.0
- VectorVest ProTrader 7
- VectorVest RealTime Derby Tool
- VectorVest Simulator
- VectorVest Variator
- VectorVest Watchdog
