HOT TOPICS LIST
- MACD
- Fibonacci
- RSI
- Gann
- ADXR
- Stochastics
- Volume
- Triangles
- Futures
- Cycles
- Volatility
- ZIGZAG
- MESA
- Retracement
- Aroon
INDICATORS LIST
LIST OF TOPICS
PRINT THIS ARTICLE
by Koos van der Merwe
I have always believed in a Gann fan as an indicator forecasting the future.
Position: Accumulate
Koos van der Merwe
Has been a technical analyst since 1969, and has worked as a futures and options trader with First Financial Futures in Johannesburg, South Africa.
PRINT THIS ARTICLE
GANN
The Beauty Of A Gann Fan
02/29/12 12:32:01 PMby Koos van der Merwe
I have always believed in a Gann fan as an indicator forecasting the future.
Position: Accumulate
| I have always believed in a Gann fan to predict the future. I have also believed in sticking with WD Gann's original number, namely 0.2, 0.5, 1, 2, 5, and so on. Fortunately, the program I have used since the 1980s allows me to apply Gann fans very easily on my charts. This helps me in forecasting where and even when a price can reach a turning point. William Gann's rules were simple. If the index is above a 45-degree angle (1x1), then it is in a strong bull trend. If the index is below the 45-degree angle, then it is in a weak bull trend. If the index is in a 1 x 4 up, then it is in an overbuy. Because an index/price is inclined to fall faster in a bear market, if the index/price is below a 2x1 down, then it is in a bear market. |

|
| FIGURE 1: GANN FAN |
| Graphic provided by: AdvancedGET. |
| |
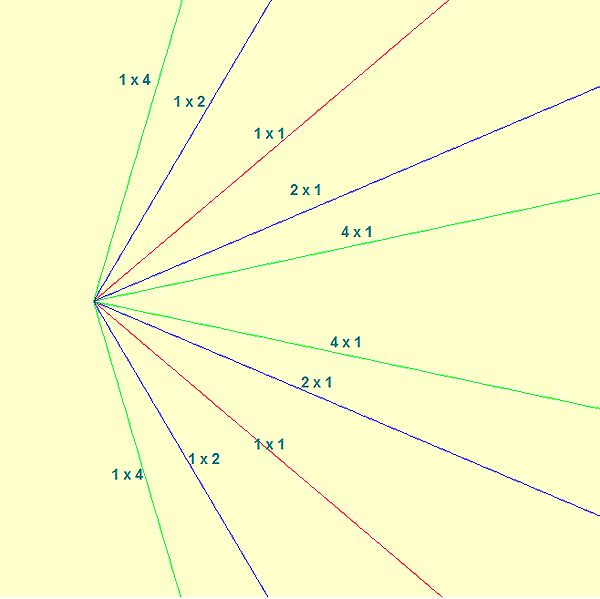
| Figure 1 is a chart of the basic Gann fan showing the counts of the various angles. The 1 x 1 line is a 90-degree angle, but this can vary on the movement of the chart; for example, if the chart moves slowly, the 1 x 1 angle could be a 0.5, and if the chart moves fast, the 1 x 1 could be a 2 and not the normal 1 = 90 degree. This allows us to draw a Gann fan to fit a chart more efficiently. |

|
| FIGURE 2: ANALYZING A CHART USING GANN FANS |
| Graphic provided by: AdvancedGET. |
| |
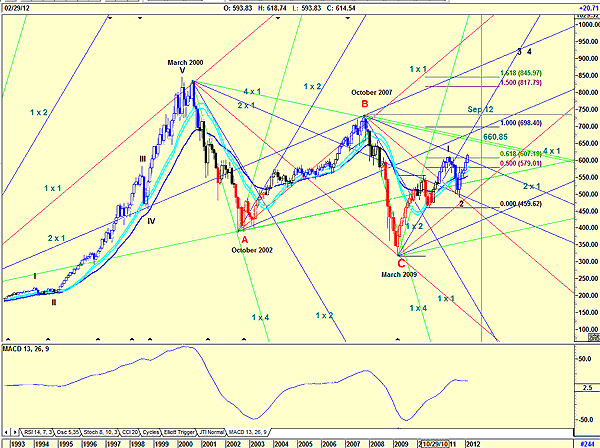
| In Figure 2, I have applied the Gann fan to all the top and bottom pivot points. Note the following: a. The 1 x 1 line on the first fan caught the top on March 2000. b. Drawing a fan with the same parameters from the high of March 2000 downward, the low of October 2002 bottomed on the 2 x 1 of the main fan, where the 1 x 4 of the fan down penetrated it. c. Drawing a fan upward from October 2002 at "A," note how the price followed the angle of the 1 x 1 after initially following the 1 x 2 angle. d. Note how on October 2007 at "B," the index tested the 2 x 1 angle of the original fan where it crossed the 4 x 1 angle of the fan drawn down from March 2000. e. The index then fell to find support on the 1 x 1 of the fan drawn from March 2000, close to where the 1 x 4 angle from the fan of October 2007 crosses the 1 x 1. f. When the index started rising from the low of March 2009, note how it found resistance on the 2 x 1 angle of the fan drawn from March 2000. Then note how it fell to the 1 x 2 angle of the fan drawn from March 2009 rose to test the 61.8% Fibonacci level of a Fib extension and corrected down to retest the 2 x 1 angle of the March 2000 fan. From this level, it rose and broke above the 2 x 1 angle drawn from the October 2007 fan. For the future, we can now expect the index to continue upward to test the 4 x 1 drawn from March 200 and October 2007. Drawing a horizontal line from October 2007, the 1 x 2 angle drawn from March 2009 suggests that the index will test the 4 x 1 in September 12 at a price of 660.85. Does all this sound complicated? Sure, but at least we know that the trend is up for now. Also, whoever said that the workings of WD Gann were simple? |
Has been a technical analyst since 1969, and has worked as a futures and options trader with First Financial Futures in Johannesburg, South Africa.
| Address: | 3256 West 24th Ave |
| Vancouver, BC | |
| Phone # for sales: | 6042634214 |
| E-mail address: | petroosp@gmail.com |
Click here for more information about our publications!
Comments

Request Information From Our Sponsors
- StockCharts.com, Inc.
- Candle Patterns
- Candlestick Charting Explained
- Intermarket Technical Analysis
- John Murphy on Chart Analysis
- John Murphy's Chart Pattern Recognition
- John Murphy's Market Message
- MurphyExplainsMarketAnalysis-Intermarket Analysis
- MurphyExplainsMarketAnalysis-Visual Analysis
- StockCharts.com
- Technical Analysis of the Financial Markets
- The Visual Investor
- VectorVest, Inc.
- Executive Premier Workshop
- One-Day Options Course
- OptionsPro
- Retirement Income Workshop
- Sure-Fire Trading Systems (VectorVest, Inc.)
- Trading as a Business Workshop
- VectorVest 7 EOD
- VectorVest 7 RealTime/IntraDay
- VectorVest AutoTester
- VectorVest Educational Services
- VectorVest OnLine
- VectorVest Options Analyzer
- VectorVest ProGraphics v6.0
- VectorVest ProTrader 7
- VectorVest RealTime Derby Tool
- VectorVest Simulator
- VectorVest Variator
- VectorVest Watchdog
