HOT TOPICS LIST
- MACD
- Fibonacci
- RSI
- Gann
- ADXR
- Stochastics
- Volume
- Triangles
- Futures
- Cycles
- Volatility
- ZIGZAG
- MESA
- Retracement
- Aroon
INDICATORS LIST
LIST OF TOPICS
PRINT THIS ARTICLE
by Billy Williams
Although it is one of the most reliable patterns, price channels are often one of the most underutilized, which is a shame, since it reveals low-risk trade setups as well as when trend reversals develop.
Position: Buy
Billy Williams
Billy Williams has been trading the markets for 27 years, specializing in momentum trading with stocks and options.
PRINT THIS ARTICLE
TREND-CHANNEL
How To Trade Price Channels
02/29/12 09:27:07 AMby Billy Williams
Although it is one of the most reliable patterns, price channels are often one of the most underutilized, which is a shame, since it reveals low-risk trade setups as well as when trend reversals develop.
Position: Buy
| One of the most common patterns in the market also remains one of the most unused price patterns, and that is the price channel. Price channels are often overlooked because most technicians use trendlines in the classical form where bullish markets are connected from the lowest intraday price low to the highest intraday price low, while bearish markets are connected from the highest intraday price high to the lowest intraday price high with both trendlines drawn without crossing through any price action along its drawn lines. |
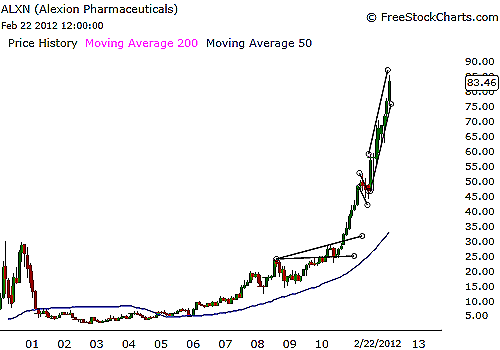
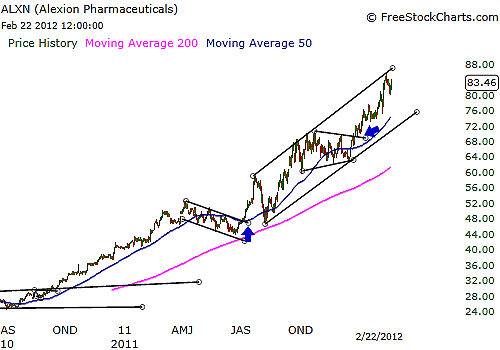
| Price channels can be used for spotting turns early in the course of a trend as a shift occurs in the underlying dynamics of the market's price action as one of the upper or lower price levels, or trendlines, are violated followed by a series of highs and lows in the opposite direction. If you are aware of the signs of such a change, it allows you to gain an early advantage by catching a new trend just as it is emerging while also giving you a warning signal that things are about to change and give you the opportunity to exit early. In addition, it allows you to gauge the direction of the current trend to spot low-risk trades that are setting up within the framework of the price channel itself. See Figures 1 and 2. |

|
| FIGURE 1: ALXN, MONTHLY. On the monthly chart, ALXN broke the upper trendline, signaling a bullish run to the upside. |
| Graphic provided by: www.freestockcharts.com. |
| |
| For a channel to form, you need significant highs and lows that connect with a trendline without intersecting any of the other price action with an intervening high or low, depending on the market. Price channels can be formed upward as price trades in a bullish trend, sloping downward in a bearish trend, trading back and forth within a trading range, or in a neutral price channel. Depending on the type of price channel, you want to look to always trade in the direction of the dominant trend of support or resistance, depending, again, on the context of the market. |

|
| FIGURE 2: ALXN, DAILY. On the daily chart, ALXN formed two price channels -- downward and upward -- that showed a trend reversal on the first channel as price broke higher and the other revealed a low-risk long entry during its upward climb. |
| Graphic provided by: www.freestockcharts.com. |
| |
| When price begins to form a series of highs and lows in the opposite direction, that is the sign that the previous trend has lost its strength and/or momentum and it is time to trade in the opposite direction. As an aside, Paul Tudor Jones, the billionaire hedge fund manager profiled in Jack Schwager's book "Wizards of Wall Street," uses a similar strategy to catch turns in the market and has had tremendous success trading trend reversals almost to the point of exclusion. |
| Keep in mind, while trading ranges are a type of price channel and the pattern that most traders are schooled in, the upward or downward price channel are like angled trading ranges where you can still trade off support or resistance but you still want to place your stops accordingly on the opposite end of the trendline in the event of the unexpected. |
Billy Williams has been trading the markets for 27 years, specializing in momentum trading with stocks and options.
| Company: | StockOptionSystem.com |
| E-mail address: | stockoptionsystem.com@gmail.com |
Traders' Resource Links | |
| StockOptionSystem.com has not added any product or service information to TRADERS' RESOURCE. | |
Click here for more information about our publications!
PRINT THIS ARTICLE

Request Information From Our Sponsors
- StockCharts.com, Inc.
- Candle Patterns
- Candlestick Charting Explained
- Intermarket Technical Analysis
- John Murphy on Chart Analysis
- John Murphy's Chart Pattern Recognition
- John Murphy's Market Message
- MurphyExplainsMarketAnalysis-Intermarket Analysis
- MurphyExplainsMarketAnalysis-Visual Analysis
- StockCharts.com
- Technical Analysis of the Financial Markets
- The Visual Investor
- VectorVest, Inc.
- Executive Premier Workshop
- One-Day Options Course
- OptionsPro
- Retirement Income Workshop
- Sure-Fire Trading Systems (VectorVest, Inc.)
- Trading as a Business Workshop
- VectorVest 7 EOD
- VectorVest 7 RealTime/IntraDay
- VectorVest AutoTester
- VectorVest Educational Services
- VectorVest OnLine
- VectorVest Options Analyzer
- VectorVest ProGraphics v6.0
- VectorVest ProTrader 7
- VectorVest RealTime Derby Tool
- VectorVest Simulator
- VectorVest Variator
- VectorVest Watchdog
